With advancements in satellite technology, imagery can be taken from peak biomass to create a zone map based on how the crop performs out in the field. These maps generally look very close to how the yield map will look after harvest.
 Enhanced Zoning Using Multiple Sources of Data
Ben D. Johnson, CCA, Product Marketing Manager | FarmersEdge
Straight lines rarely exist in nature, so when it comes to managing our fields, it only makes sense to identify the variability in our fields accurately.
Years ago, soil sampling was done by driving out to the field after harvest, getting samples from the high and low spots in the field, and a few in between. You’d send those samples off to the lab and when you got the results, you’d average those numbers together and set out to the fields with a flat rate. If you had a little foresight, maybe you’d scratch down a map of where you took the samples so you could see where there was an issue in case one of your samples seemed off.
Then, GPS technology became readily available, allowing us not only to record where we took samples but also to document the specific intervals across the field. We could then revisit the same areas time after time and watch the changes in the soil test values in those particular areas.
That was a good system; however, there were many situations where the straight lines of a grid pattern missed key topographical features and the soil test wasn’t quite as representative of the field as we’d like it to be.
Zone mapping and sampling have been around for almost as long as grid sampling, except the problem with those early renditions were that the zones weren’t very accurate. In the U.S., zone maps were typically created from the SSURGO soil maps that the government created to assess how much taxes they should charge a landowner. From about roughly the 1960s to the 1980s, these maps were hand-drawn. In some places, the maps are decently accurate. However, in many places, they leave a lot to be desired and are not precisely at the level of accuracy that you should base your precision ag program on.
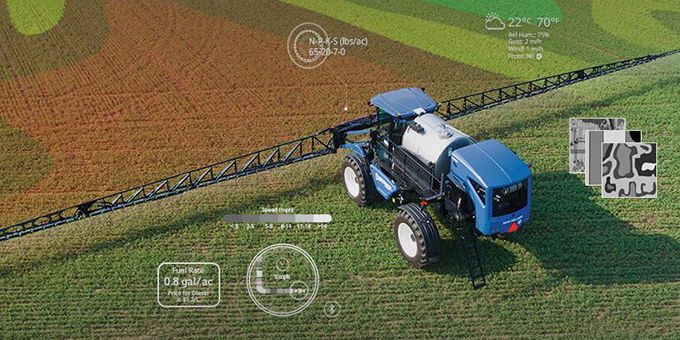
With advancements in satellite technology, imagery can be taken from peak biomass to create a zone map based on how the crop performs out in the field. These maps generally look very close to how the yield map will look after harvest. Yield maps, on the other hand, are created by the combine, which develops a pixel that is the size of the header that can be 20-30 feet or more across. Satellite imagery has a 5-meter resolution and provides a more detailed map of the field.
At Farmers Edge, we’ve recently enhanced this process even further by utilizing multiple data sources to create our Zone Maps. Historical imagery, in-season imagery, and elevation data are combined to create more detailed Zone Maps. Using this enhanced zoning method, you can better manage intricate variabilities more precisely and accurately.
We can then take those more elaborate zones and merge or dissolve them as we see fit through a conversation through agronomist and grower. The result is something the grower and their team of trusted advisors are going to use confidently. In tight commodity markets like this, the devil is in the details.
Utilizing in-season daily satellite imagery helps guide Variable Rate (VR) applications for products such as fungicide that are based on the crop’s current performance. Waiting for a yield map would be too late; relying on purely historical data wouldn’t account for the unique conditions of the current growing season.
Talk to your local Farmers Edge representative today to learn more about VR product applications using our enhanced zoning capabilities.
The content & opinions in this article are the author’s and do not necessarily represent the views of AgriTechTomorrow
Comments (0)
This post does not have any comments. Be the first to leave a comment below.
Featured Product