Accurate observations are important and useful, but one must also get to the root of what the real problem is, understand all the sources of uncertainty, and understand that modeling techniques offer a consistent approach to filling in gaps
 Rainfall Revisited: Accurate Observations And Beyond
Brent Shaw | Iteris, Inc.
This article was originally published on PrecisionAg:
As a provider of weather analysis and forecast services to the agricultural industry, one of the most common questions I get asked is, “How accurate are your precipitation estimates compared to a gauge?”
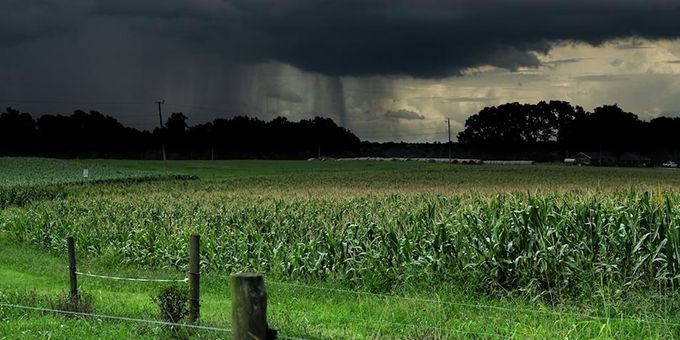
Earlier this year, I wrote a bit about the spatial variability of rainfall and some of the reasons a radar-derived area estimate won’t usually exactly match a point gauge measurement and how gauges themselves may not be representative of actual rainfall over the entire field or even a nearby field. After an abnormally wet August in my home state of Oklahoma, I felt inspired to do some real-world comparisons of measurement variability, using my own gauges and selected nearby gauges.
As a meteorologist, weather enthusiast, accuracy-freak, and an official observer for the Community Collaborative Rain, Hail, and Snow Network (CoCoRaHS), I take great care to make sure my instruments are installed and maintained properly. I have two different gauges installed less than 10’ from each other at nearly the same height. My “official” gauge is a manual Stratus RG202 cylindrical rain collector with a 4” funnel, providing measurement accuracy of 0.01”. I check this gauge daily at 7:00 a.m. local time and have been providing observations to CoCoRaHS for this location since 2005.
My second gauge was installed in late 2017 and is an automated tipping bucket that is part of a Davis Vantage Pro2 Plus weather station. It also provides measurements to the nearest 0.01” and has the advantage of being automatically recorded. The Davis station is a popular choice for agricultural applications, and they come from the factory fairly well calibrated. Having these two gauges during this growing season has given me a great opportunity to do some real-world comparisons of collocated gauges.
Comparing Collocated Gauges
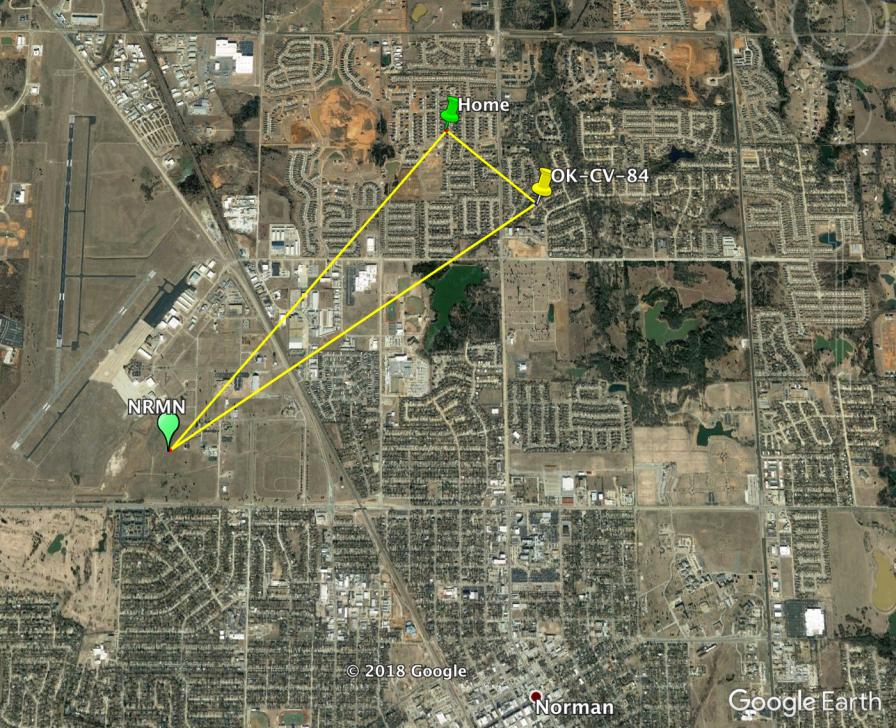
I computed monthly rainfall totals for the period March through August, since the warm season eliminates issues of having to deal with snow measurements. In addition to my two gauges, I obtained data from two other nearby trusted sites. A map of the sites and table of results and site description are included below.
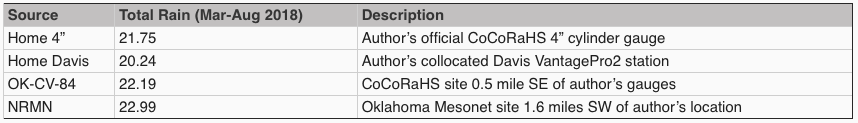
First, it is notable that the total rainfall between my two gauges differs by 1.51”, about a 7% difference. Although you might assume the Davis has a low bias compared to my 4” gauge, there were multiple events where it recorded more rain than my 4” gauge, and while not shown here, the May monthly total was higher for the Davis bucket than my cylinder. However, it is well-documented in scientific studies that tipping buckets can undercount compared to collection gauges in heavy rain events, and we had several of those in our typical Southern Plains thunderstorm activity over the season.
For the nearby sites, station OK-CV-84 is another CoCoRaHS site using the same model 4” rain gauge as mine. The NRMN station is an Oklahoma Mesonset site with an automated tipping bucket gauge. Across all four of the gauges, the estimates range from 20.24” to 22.99”, or from about 7% less to 5% more than my 4” gauge. The two tipping buckets differed from each other by 13% and the two 4” manual gauges by about 2%. However, the two manual gauges were closer to each other (0.5 mile apart) than the tipping buckets (1.6 miles). Nevertheless, the differences are due to a combination of measurement method, calibration, siting, and location, even within a relatively small area, and if you only had this one small study to go by, you might infer there could be a 5-10% uncertainty of any measurement as being “truth” on a field, even from a properly installed and maintained gauge. These results are consistent with a very rigorous, 30-month scientific study that compared measurements from six, high-end professional gauges (three tipping buckets and three weighing buckets) installed within the same 25 meter by 25 meter plot.
I took this one step further and compared these gauge results to two other commonly used sources of data for local precipitation: grid-based analyses and nearest climate station of record. For the grid-based values, I looked at historical data queried from my company’s ClearAg weather API service as well as from the National Weather Service’s Advanced Hydrological Prediction Service (AHPS) monthly analysis data. In both cases, I used values for the grid cell (2-km for ClearAg, 4-km for AHPS) containing my home location. Rather than assuming any one of the four gauges was the “truth” and given that they are being compared to a grid cell estimate, I used the average of the four stations as “truth.”
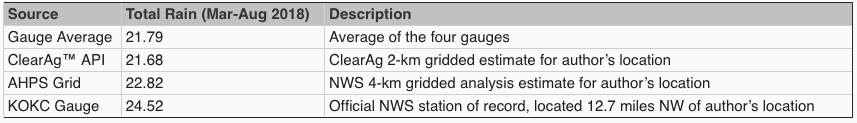
Both gridded analyses, which are heavily influenced by radar information, provided credible results. The ClearAg value was less than 1% different from the four-gauge average with a difference of 0.11” below. The AHPS was about 5% different, showing 1.14” more rain than the gauge average.
Since many agricultural weather services rely on the nearest trusted climate station for long term history, the accumulation at the nearest NWS climate station, KOKC, about 13 miles away from my home, is shown. As expected, it had the largest difference from the gauge average, with 2.73” (about 13%) more rain reported.
Observations vs. Estimates
So what are some key takeaways from this informal study? I offer these:
- Even the best of gauge estimates have uncertainty that is greater than the measurement precision, especially once you exceed 0.5” of accumulation.
- Gridded, virtual rain gauge estimates can provide a good estimate within the same level of error as other gauges over a representative area.
- The collocated grid-based estimates are better than using a more distant trusted observation.
One final question to consider: Do these levels of error matter? Certainly, when you accumulate values over a long period, especially to months or years, a small percentage difference can appear quite large in terms of absolute depth. But, this may be misleading and irrelevant for the problem you are attempting to solve. I submit that the most common uses of rainfall for agronomic purposes are:
- Ascertaining field workability issues
- Managing irrigation to optimize plant growth (i.e., how much water is available to the plant’s roots)
- Management of nitrogen or other products that are water soluble or that can be transported through the soil by water
- Determining disease pressure or making spray decisions based on leaf canopy wetness
The reality is that for those applications, precision to the nearest 0.01” is unnecessary and gives a false sense of accuracy, given that a point measurement of that precision is only representative of that point, and doesn’t account for what happens when the water hits the ground or plant.
For example, imagine two extreme scenarios, both of which are a perfectly flat field. Scenario one is a field made of smooth, impenetrable glass. In this case, you can imagine that any water falling on any point on that “field” will immediately spread out across the field until it reaches an infinitely small depth. The second scenario assumes a field made of a steel “honeycomb” with vertically pointing cylinders. Any rain falling on a point in that field stays in the cylinder in which it falls, and goes nowhere horizontally.
Now, we all know that these are both unrealistic scenarios, but they both would be the easiest to model how much water depth exists at any point given a point measurement of rainfall. In reality, fields are rarely flat, nor are they uniform in their composition. So, in addition to measurement errors of a gauge at a point, the water itself may percolate to different levels, move horizontally, be intercepted by the plant canopy, and so on.
Quickly you can see how worrying about 0.01” accuracy at a point may be the least of your concerns. Additionally, it may be best to use an area-averaged estimate rather than a point method, meaning even though they don’t match a gauge, a gridded analysis of sufficient resolution may be better than a point measurement. This is one of the reasons I believe technologies such as coupled, predictive atmosphere, soil, and plant models offer the best solution for farm management decision aids over traditionally used methods such as those based on balancing rainfall and estimated evapotranspiration.
Accurate observations are important and useful, but one must also get to the root of what the real problem is, understand all the sources of uncertainty, and understand that modeling techniques offer a consistent approach to filling in gaps and getting to the desired decision much more efficiently and accurately.
The content & opinions in this article are the author’s and do not necessarily represent the views of AgriTechTomorrow
Comments (0)
This post does not have any comments. Be the first to leave a comment below.
Featured Product