In this study, calibrated NDVI values showed a strong correlation with the level of disease visually scouted by researchers in the field. In fact, the NDVI map was able to successfully indicate differences in barley yield between the treatments.
Contributed by | MicaSense
Reposted with permission from the MicaSense blog:
Using multispectral data, a group of researchers from North Dakota State University are helping the state’s barley growers control fungal diseases and reduce the impact on yield and seed quality.
View the Atlas data from this article here.
Fungal disease: a latent threat to barley growers
Fusarium Head Blight (FHB) is a fungal pathogen that develops in warm, humid environments and affects a wide array of crops, including barley. FHB decreases grain yield and quality by impacting its development, producing shriveled, discolored, and underweight kernels.
North Dakotan crops are especially vulnerable to this disease, resulting in estimated yield losses of 5–10% per year. Between 2010 and 2014 the production loss in the state ranged from $25 to $280 million.
Concerned about the financial impact of this disease, a group of North Dakota State University researchers at the Carrington Research Extension Center conducted an experiment in the summer of 2016 to study different fungicide treatments to control FHB in barley.
Validating fungicide applications
The group tested ten fungicide treatments applied at different times during the growing season, with the earliest application made on June 2nd (4.0–4.5 leaf stage) and the latest on July 1st (Feekes 10.50 stage). All treatments were irrigated throughout the season with the same amount of water. In addition, chopped wheat straw was distributed over newly emerged barley to provide a localized source of disease inoculum.
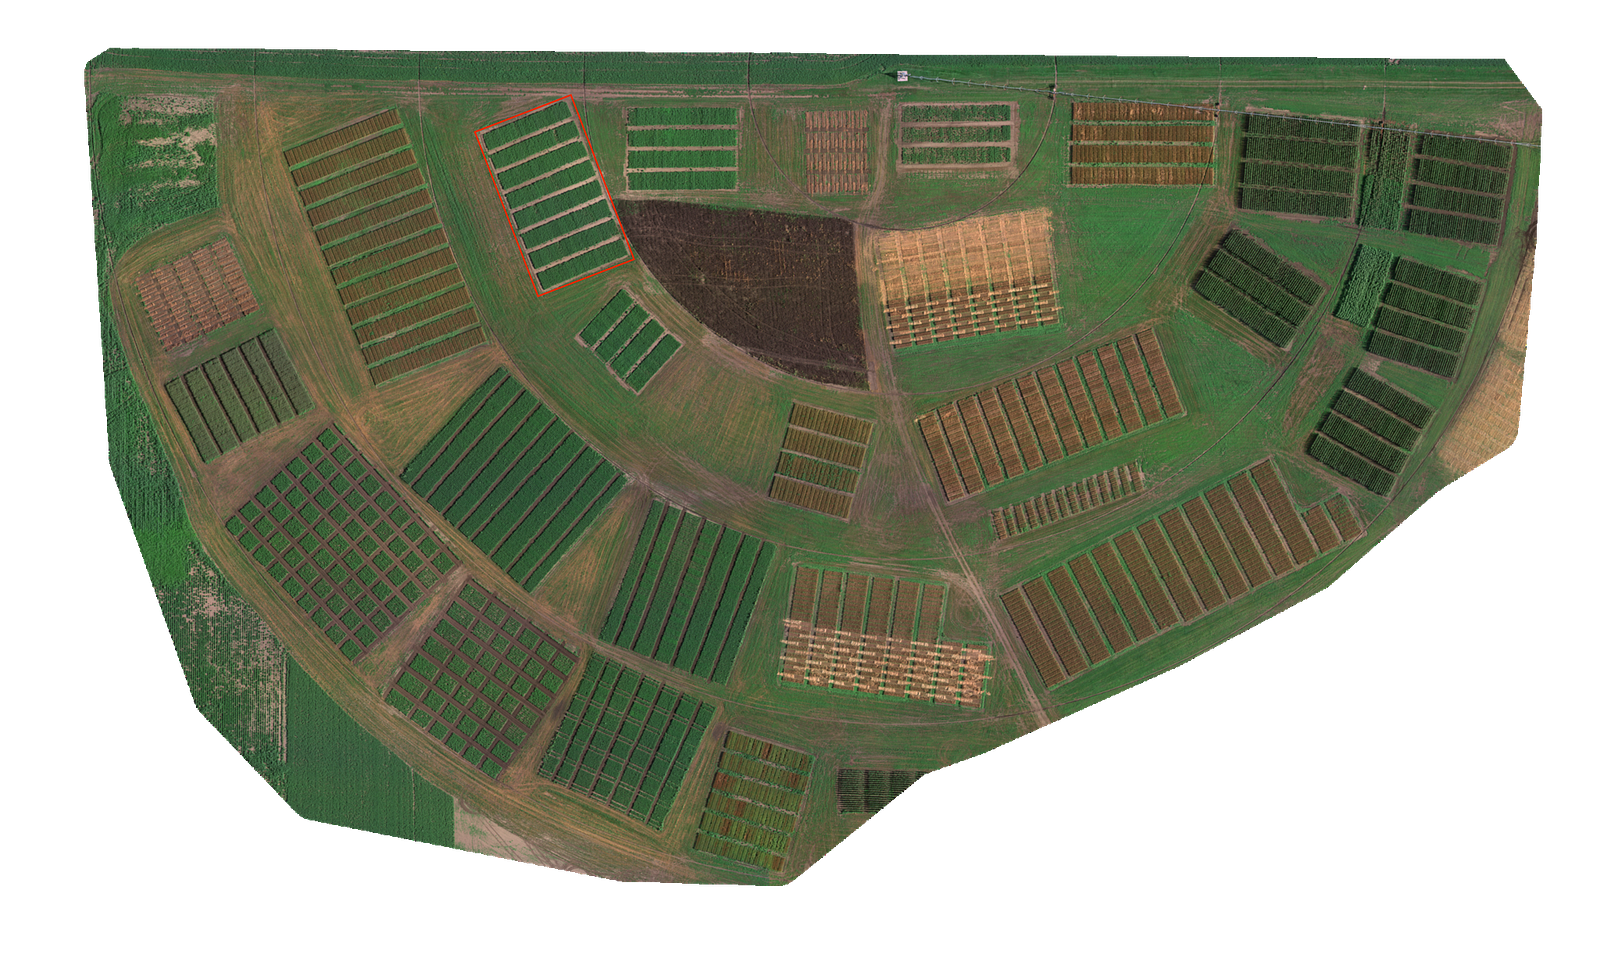
RGB image of the plot (in red) where the researchers tested the fungicide treatments.
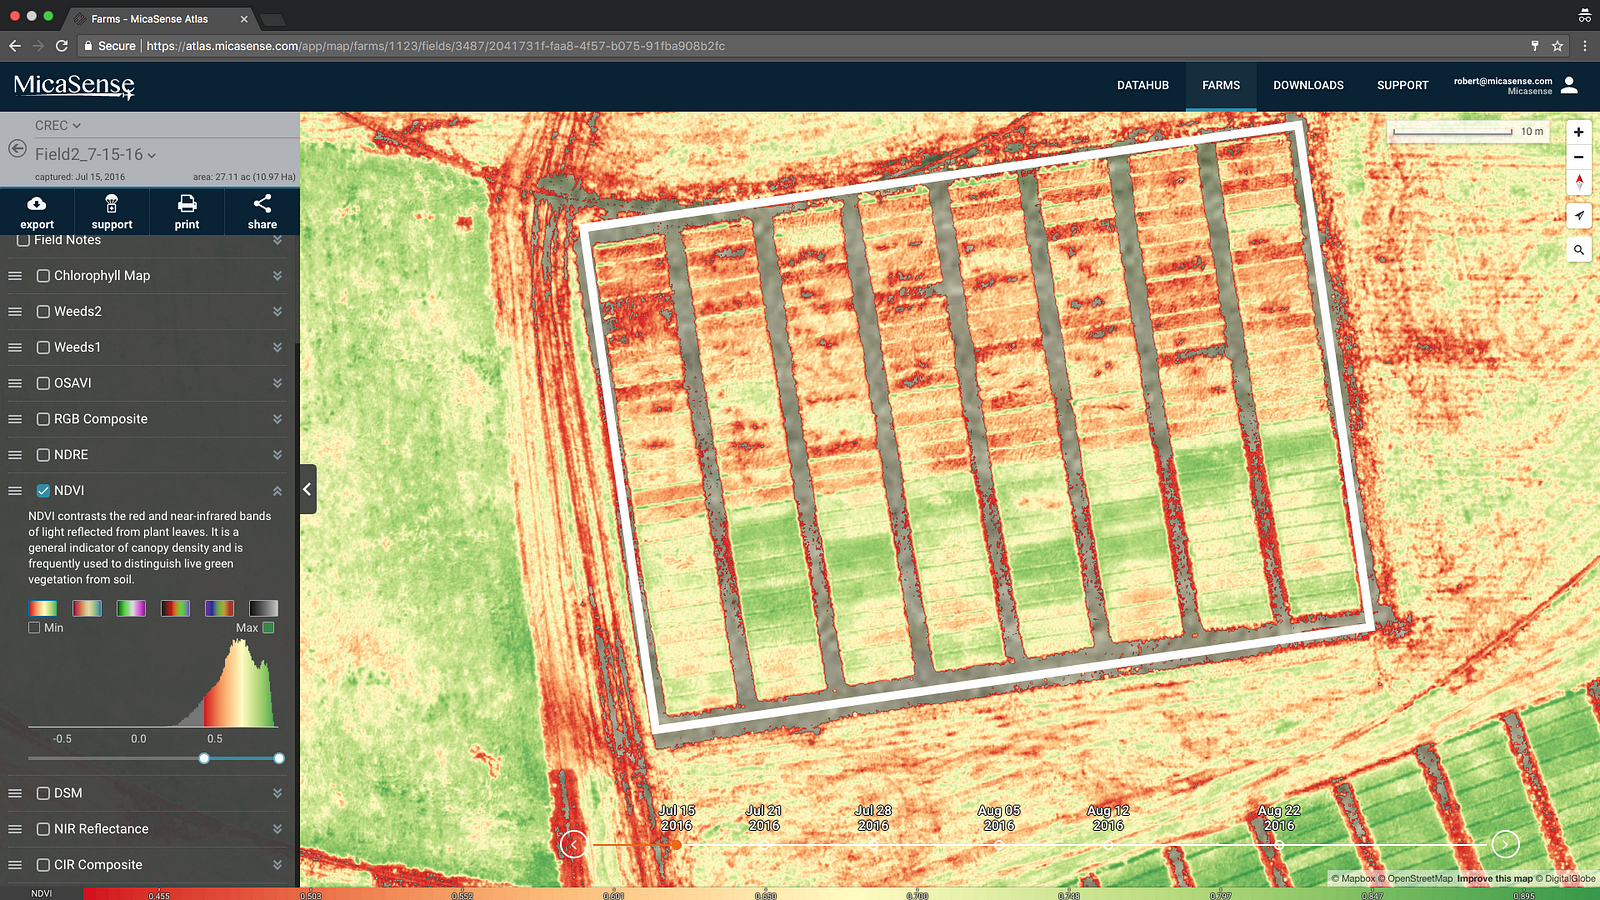
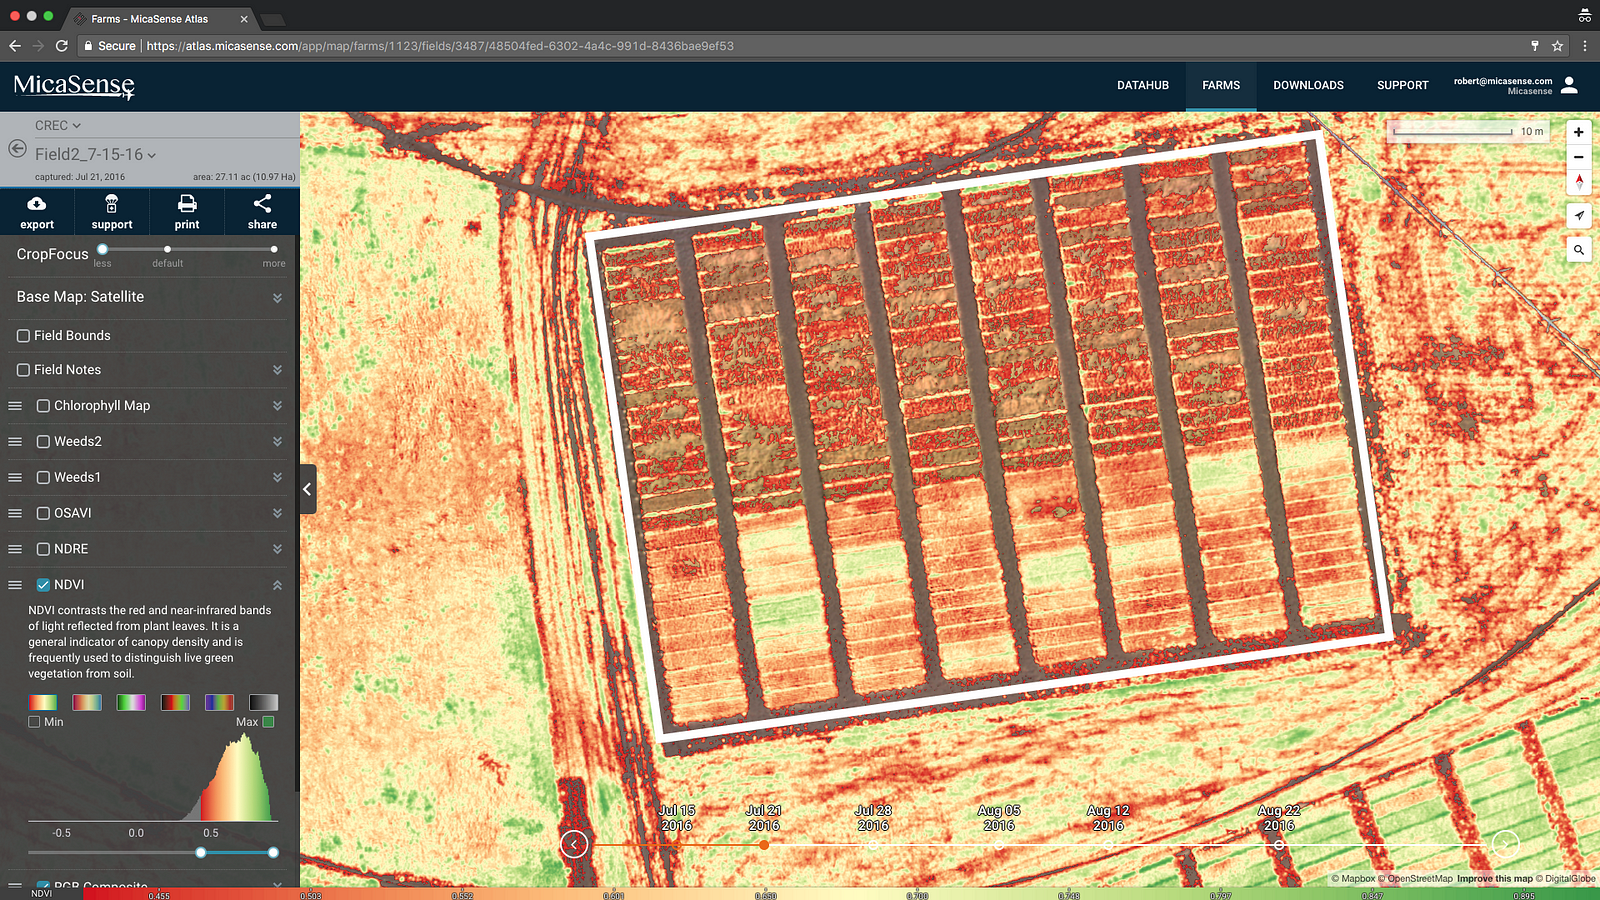
Once the treatments were applied, the researchers mapped the field on July 15th [Figure 1] and July 21st [Figure 2] using the MicaSense RedEdge. Then, they used MicaSense Atlas to generate two calibrated NDVI maps.

July 15th NDVI (range 0.46–0.95) — NDVI quantifies plant vigor. Plots of low NDVI have little to no green plant tissue remaining.

July 21st, NDVI (range 0.27–0.95) — The difference between the two NDVI maps corresponds to the levels of maturity in barley.
The NDVI maps (above) detail the treatment outcome for each plot. Green plots indicate where the treatment was most effective, yellow where the treatment effect was minimal, and red where the plant diseases thrived the most, leaving crops with little to no green plant tissue remaining.
As barley matures, the leaves and stems begin to drydown as the plant moves its nutrients upwards into the developing grain. When a plant is stressed due to a disease, it matures faster and the result is an overall shorter life span and lower yield.
Takeaways
In this study, calibrated NDVI values showed a strong correlation with the level of disease visually scouted by researchers in the field. In fact, the NDVI map was able to successfully indicate differences in barley yield between the treatments. The plots with the highest NDVI values (shown in green) proved to have lower levels of disease and produced maximum yields.
Moreover, this study provides further proof of the value of multispectral imagery as an objective source of information to support management decisions. In this case, researchers were able to use multispectral imagery to accurately evaluate the impact of fungicide treatments on their crops, and take steps to minimize the adverse effects on yield and seed quality through the season.
To view the different vegetative indices available in Atlas, check out our example data set. If you have a case study with RedEdge, Sequoia, or Atlas that you would like to showcase, please send us an email here.
The content & opinions in this article are the author’s and do not necessarily represent the views of AgriTechTomorrow
Comments (0)
This post does not have any comments. Be the first to leave a comment below.
Featured Product


