There are many different types of potential applications of AI in agriculture -- ranging from machine control, to image analysis, to improving our understanding of where, when, and how a crop might respond toparticular environmental conditions.
Artificial Intelligence in Agriculture: Understanding Crop Growth
Dr. John Mewes | Iteris
In recent years, there’s been no shortage of buzz in the agricultural industry about the seemingly bright prospects for using artificial intelligence (AI) to address a broad range of problems in the ag space. Unless you’ve spent time really educating yourself, you may well be wondering what all the hype is about. There are many different types of potential applications of AI in agriculture -- ranging from machine control, to image analysis (to identify weeds or diseases, for instance), to improving our understanding of where, when, and how a crop might respond to particular environmental conditions, or a particular product application, using ‘big data.’
Though rather small relative to the potential size of agricultural datasets, the Farmers’ Independent Research of Seed Technologies (F.I.R.S.T.) test plot data provides an opportunity to demonstrate the power of AI applied to big data in order to understand the environmental factors driving corn growth. Corn is a useful crop for the purposes of this demonstration because it is one of the most researched and well-understood crops (i.e. we already know a lot about the corn plant, so we can compare any AI-based findings about the crop against more than a century’s worth of independent research that has already been carried out). In turn, this can give us indications of how much confidence we can have in what AI might be able to reveal about the behavior of other, less-understood crops.
In this example, we’ll apply F.I.R.S.T. test plot data from 2008-2016 (including location, planting date, relative maturity, harvest date, and harvest moisture) to automatically create a crop growth model for the crop. The algorithm basically seeks to define the form of a ‘growth response function’ that yields the best possible prediction of the timing of a key event (or events) in the crop’s life cycle. Growing degree days (GDDs) are a very simple example of a ‘growth response function’, indicating how much the crop will grow in response to different air temperatures. In this case, however, we can provide a broader range of data on weather- and soil-related conditions impacting each test plot, throughout the course of each season, and allow the AI-based algorithm to seek out the relationships between these various conditions and the growth of the crop.
Figure 1 depicts what this AI-based algorithm, applied to the F.I.R.S.T. corn test plot data, reveals about the growth rate of the corn plant in terms of air temperature. In Fig. 1, the average daily air temperature increases from left-to-right, and the corresponding growth rate of the corn plant increases from bottom-to-top. The algorithm has found that the corn plant grows faster as temperatures get warmer, and provides a depiction of the range of the possible rate of growth for any given daily average air temperature (indicated by the vertical difference between the lowest and highest growth rate for a given temperature).
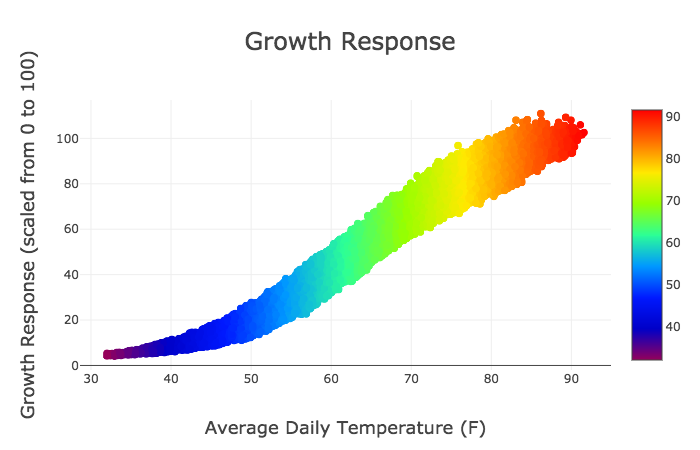
Figure 1: Corn growth rate as a function of daily average temperature, as calculated by a proprietary AI-based algorithm. The color scale in this figure depicts the daily average air temperature, and is therefore duplicative of the x-axis labels. The y-axis depicts the range of corn growth rates associated with those daily average temperatures, with higher values indicating faster growth.
So why is there a range in the possible rate of growth for a given temperature? It’s indicative of the fact that temperature is not the only factor driving the growth of a corn plant. Other environmental factors can enhance or reduce the growth rate that is implied by the air temperature.
How does this growth response function compare to others that have been developed over the years? Figure 2 gives us a glimpse, with the smaller black dots indicating the growth responses for the same locations and dates, calculated from GDDs. In Figs. 2a and 2b, we see that the GDD- and CHU-based equations yield calculated growth responses that fall into the same general range as the new AI-based growth response function we’ve just ‘automagically’ calculated. The arrangement of the black dots in the GTI comparison (Fig. 2c) looks a bit different, in that they fall along a couple of very specific lines representative of the separate GTIv (vegetative stage) and GTIr (reproductive stage) formulas. Since these GTI formulas use the daily average temperature as an input, rather than both the daily minimum and maximum temperatures as the others do, there is no ‘spread’ in the calculated growth response for a given daily average temperature.
.png) (a)
(a)
.png) (b)
(b)
.png) (c)
(c)
Figure 2: Comparisons between the rates of corn growth as calculated via the AI-based algorithm (colored dots) as compared to the growth rates calculated from (a) GDDs, (b) CHUs, and (c) GTI (black dots). Each dot represents a specific test plot and date in the F.I.R.S.T. 2008-2016 corn dataset.
So what? In the case of corn, we more or less knew the general form of the temperature dependence in the growth response from previous research, but these results show how AI can quickly break down data to inform us about the nature of such relationships. It’s important to note that the AI-based algorithm applied here was given no prior information on the expected form of the temperature-to-growth-rate relationships: the algorithm ‘found it’ in the data itself. Further, while additional research would be required to demonstrate whether this AI-based growth response function yields consistently better predictions of corn growth than the more traditionally-derived GDD, CHU, and/or GTI formulas, the shape of the envelope of growth responses as a function of temperature from the AI-based approach certainly appears more natural (smooth) than the traditional formulas. The AI-based growth response function also yields lower errors than the traditional formulas when applied to this F.I.R.S.T. dataset, though validation against an independent dataset would be a more appropriate test.
Great! So we can apply similar AI-based algorithms to any datasets we might already have (or could collect) in order to both learn and predict the relationships between environmental conditions and the timing of events in a crop’s life cycle that are of importance to the grower or researcher? While this in itself is a very big step forward, the benefits of an AI-based algorithm don’t necessarily stop there. We could slice and display the identified relationships in many different ways, to see the impacts of aspects of the crop’s environment other than temperature. What if we simply change our color scheme in Fig. 1 to represent soil moisture? This is what has been done in Fig. 3, using the soil moisture in the 40-70 cm depth range at the location of each test plot on each date, drawn from the ClearAg Soil Conditions API. Note that at warm temperatures, there is a tendency for the dots associated with a slower growth rate to be associated with drier soil conditions (blues and purples, vs. greens and yellows for more adequate moisture levels). This feature isn’t as evident in cooler weather. What does this tell us? The growth of the corn plant is slowed down in the presence of hot, dry conditions, relative to what might be achieved with more adequate moisture. Not terribly shocking you might say, but the information in Fig. 3 can help us actually quantify how much of an effect it really has. Looking at a similar figure relative to the 20-40 cm soil moisture (not shown), such plots also appear to indicate that the slowed-growth effect is more substantial when soil moisture is lacking in the 40-70 cm depth range than it is when it is lacking in the 20-40 cm depth range.
.png)
Figure 3: A visualization of the impact of soil moisture on corn growth. Values near 0 (purples and blues) indicate dry conditions, while values nearer to 1 (greens and yellows) indicate more adequate soil moisture conditions. Of particular note is the impact of inadequate (adequate) soil moisture on slowing (speeding) corn growth on days with warm temperatures. This effect is less evident in cooler temperatures, as expected.
How can we use this information? What other things might we learn from breaking down and displaying the AI-based algorithm’s output in different ways? Those might be good topics for further blog posts down the road. In the meantime, you might consider what data you or your organization might already have, or that you could collect, that could be similarly broken down to yield useful insights related to your own problem, product or operation. If you’re not collecting the necessary data already, you may well be delaying such valuable insights.
References:
- Brown, D.M., and A. Bootsma. 1993.Crop heat units for corn and other warm season crops in Ontario. Ministry of Agriculture and Food, Guelph, ON, Canada.
- Gilmore, E.C., and J.S. Rogers. 1958. Heat units as a method of measuring maturity in corn. Agron. J. 50:611–615.
- Stewart, D.W., L.M. Dwyer, and L.L. Carrigan. 1998. Phenological temperature response of maize. Agron. J. 90:73–79.
About Dr. Mewes
 Dr. Mewes serves as Chief Scientist at Iteris and manages many of the R&D activities associated with Iteris' ClearAg offerings. John holds a B.S. in Atmospheric Sciences from the University of North Dakota (1994), and both an M.S. (1997) and Ph.D. (2001) in Meteorology from the University of Oklahoma. He is a past recipient of the Douglas K. Lilly Award for Best Ph.D. Manuscript at the University of Oklahoma, as well as a past recipient of both the American Meteorological Society’s Undergraduate Scholarship and Graduate Fellowship. In his roles at Iteris, Dr. Mewes has headed many research and development efforts at the company to include weather analysis and forecasting systems, techniques for remote-estimation of field-level weather, soil and crop growth models, and associated tools for supporting crop production decisions at all stages. He has previously held part-time appointments with the University of North Dakota Department of Atmospheric Sciences, including land surface modeling work performed for the Army High Performance Computing Research Center. Dr. Mewes also farms with his brother in eastern North Dakota, growing edible beans, corn, soybeans, sunflowers, and small grains, both conventionally and organically.
The content & opinions in this article are the author’s and do not necessarily represent the views of AgriTechTomorrow
Comments (0)
This post does not have any comments. Be the first to leave a comment below.
Featured Product