This study monitored the growth of ‘Coastal Star’ romaine lettuce crops grown under an orange-red UbiGro luminescent quantum dot (QD) greenhouse film, and identical crops grown under a colorless control film at the Santa Fe Community College Research Greenhouse.
 17% Yield Boost in Romaine Lettuce Trial
Case Study from | UbiGro
ABOUT THE PROJECT
EXPERIMENT
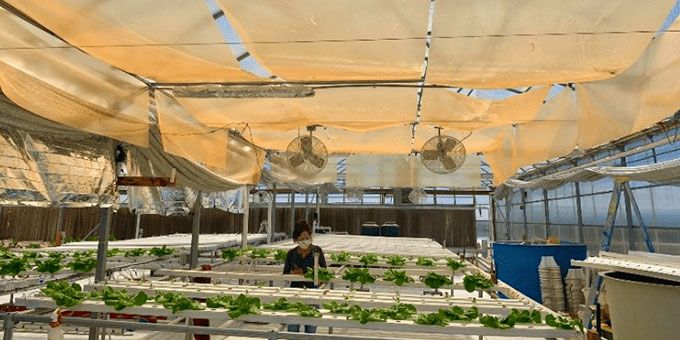
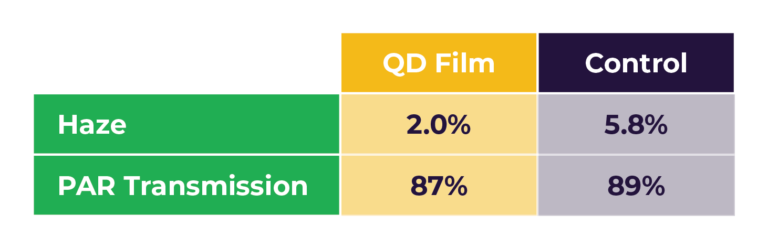
UbiGro QD greenhouse films emitting at 600 nm were installed above a 254 ft2 (23.6 m2) nutrient film technique (NFT) system inside the Santa Fe Community College Research Greenhouse (SolaWrap cover, 83% PAR transmission). An identical neighboring NFT area in the greenhouse was chosen to serve as the control group, over which a clear polyethylene film (K50 Clear 6 mil, RKW Klerks) was installed to balance the light intensities and diffusivities between the two areas (see Table 1 describing the haze and transmission of the QD film and the polyethylene control film). A reflective mylar barrier was hung between the two areas to prevent light mixing between treatment areas. A Watchdog Plant Growth Micro Station with four quantum light sensors was installed to measure daily light integral (DLI) on each side of the experiment using five-minute measurement spacings. Crops were grown with Calcium Nitrate, Magnesium Sulfate, and Potassium Nitrate-rich nutrient salt solutions with targets of EC 1.7 and pH 5.8. In order to better achieve proper light intensity for lettuce, shade curtains were deployed over the crops in both treatments until August 26 (covering the first three crops in this experiment), when they were removed.
Table 1. Optical properties of the QD film and the polyethylene control film.
Every week for 12 weeks starting in July 2021, two groups of 27 plants were seeded in Oasis Rootcubes on an ebb-and-flow seedling table inside the greenhouse. Each pair of plant groups was transplanted into the NFT system, under the QD film and control films, at 21 days after sowing (DAS). In order to explore differences in growth rates over time, each transplant group was split into three subgroups, where each subgroup consisted of 9 plants. Each subgroup was harvested a week apart from the others in order to explore all stages of growth – early to late (mature). The staggered harvest times ranged from 39 DAS to 59 DAS. Separating the staggered harvests into DAS ranges allows a better understanding how development changes over time under the altered QD film spectrum. Amongst 12 crop groups, a total of 35 individual harvests (subgroups) were made during the experiment. The first harvest was completed on August 20, 2021, and the final harvest was completed on November 23, 2021.
HARVEST DATA
Staggered harvests were grouped into similar DAS ranges, as indicated in Table 2, such that four growth stages were explored: very early growth (39 DAS), early growth (44-46 DAS), mid growth (51-53 DAS), and late growth (56-59 DAS). Due to labor scheduling, the harvests were conducted ±2 days from the target nominal DAS. The maturity time for this lettuce species is 57 DAS according to seed purveryer Johnny Seeds, so these ranges represent harvest times up to a typical harvest time for a commercial grower; however, this 57-day maturity time can vary with sunlight intensity, seasonality, climate and other variables.
*Table 2. Harvested wet weights, % difference and p-value for lettuce harvests from four growth stages. * indicates that the difference is not significant beyond a 95% confidence threshold.
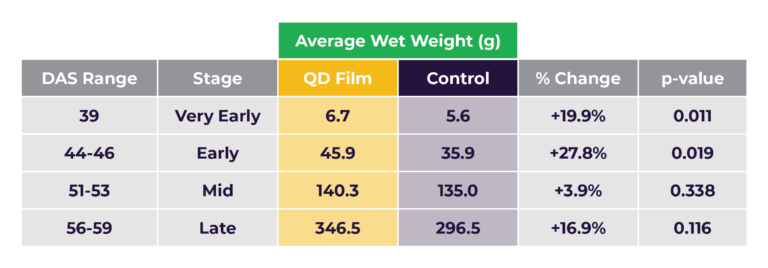
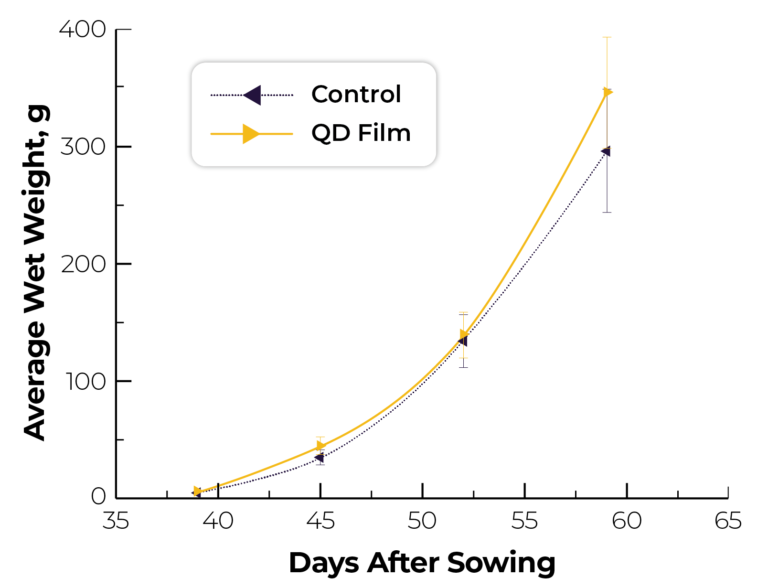
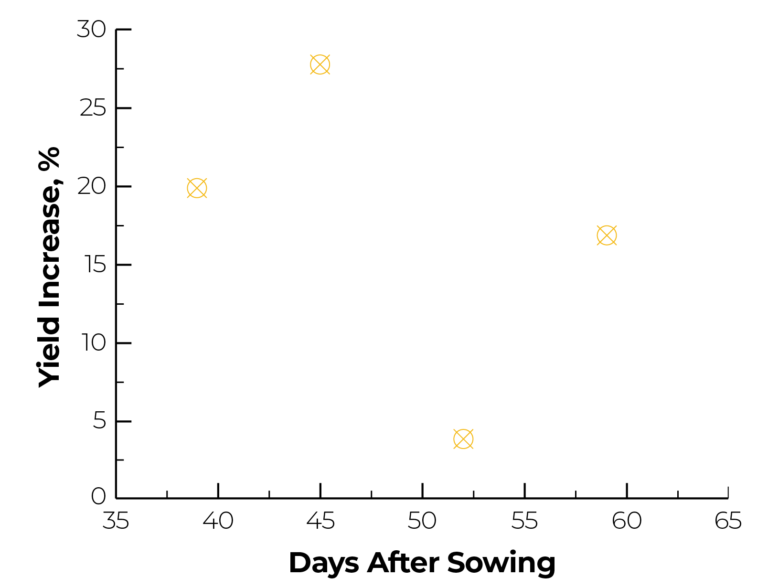
*Figure 1. Top: Growth curves for lettuce grown under the QD film and under the control film, with 1 standard deviation error bars. Bottom: Average wet weight yield increases for different DAS ranges for staggered harvests.
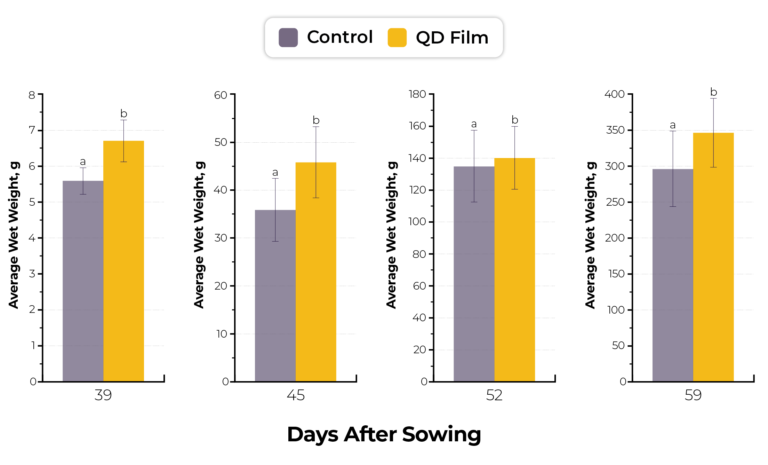
*Figure 2. Average wet weight yields for different DAS ranges for staggered harvests, with 1 standard deviation error bars. Plots marked with the same letter are not statistically significant beyond a 95% confidence threshold. Plots marked with different letters are statistically significant beyond a 95% confidence threshold.
The harvest results were analyzed with a t-Test (two-sample assuming unequal variances) and corresponding p-values are show in Table 2. This analysis showed that the yield improvements observed for very early and early harvests were statistically significant beyond a 95% confidence threshold, meaning that the difference was highly likely to be a result of an existent relationship. For mid and late growth, yield enhacments were observed but the differences were not statistically significant. For mid growth, the difference was too small (+4%) to be significant beyond the variance in the dataset. For late growth, the enhancement reappears (+17%), but so was the variance in the dataset, leading to a p-value of 0.116. The large variance could have been due to a number of factors, including shading by neighboring plants as they got larger and saturation of growth size for mature plants. Earlier development is expected to result in larger plants in all stages, so this behavior is surprising; more data on a larger scale could further clarify this result.
One possible explanation is a growth curve shape that is not exponential, but rather exhibits a mid-plateau, shown in Figure 3. For this shape, a faster growth rate in early stages (orange line) would essentially shift the curve left from the normal curve (blue line), and probing the differences are various times along the curve (red arrows) would lead to yield enhancements that could appear reduced at the mid-pleateau. To verify this, more granular steps in the DAS range would have to be probed.
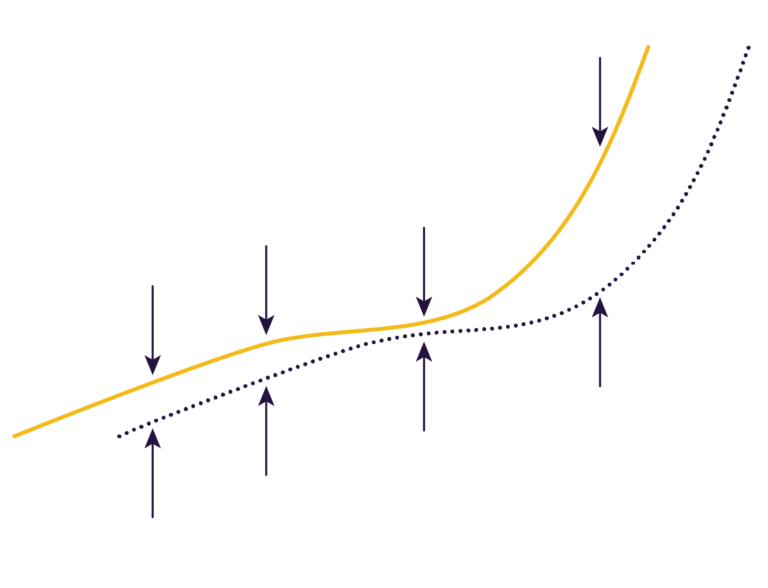
*Figure 3. Sketch of growth curve shape that may explain the yield enhancements observed in this experiment. The orange line represents the enhanced QD film growth, and the blue line represent normal growth. The orange line is shifted left to represent a faster growth rate. Red arrows indicate the four DAS ranges for which yields were probed in this experiment.
LEAF LENGTH DATA
During growth and prior to harvest, longest leaf length was measured weekly, with measurements beginning on 28-30 DAS for eight of the crops, and on DAS 35-37 for the other four. This measuement frequecy allowed for 4-5 leaf length measurements per group before the final harvest of that group. For a given group of up to 27 plants, nine plants were randomly selected for leaf length measurement with the results averaged. A total of 106 leaf length datasets (954 plants measured) were made among the 12 groups.
Similar to the wet weight analysis, leaf length measurements were broken down into DAS groups to compare the growth rates at approximately weekly intervals. Leaf length measurements outside of one standard deviation from the mean were omitted from the dataset. Leaf length data as a function of DAS are plotted in Figure 4 and 5, and results summarized in Table 3. A fairly consistent trend of +3 to +9% longer leaves was observed for all DAS ranges. The differences were statistically significant for two of the five DAS ranges. The average leaf length increase was +6.1% for all DAS ranges.
*Table 3. Average leaf length data for DAS ranges approximately 1 week apart. * indicates that the difference is not significant beyond a 95% confidence threshold.
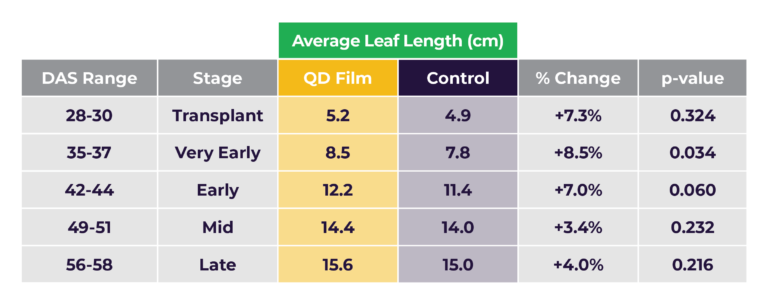
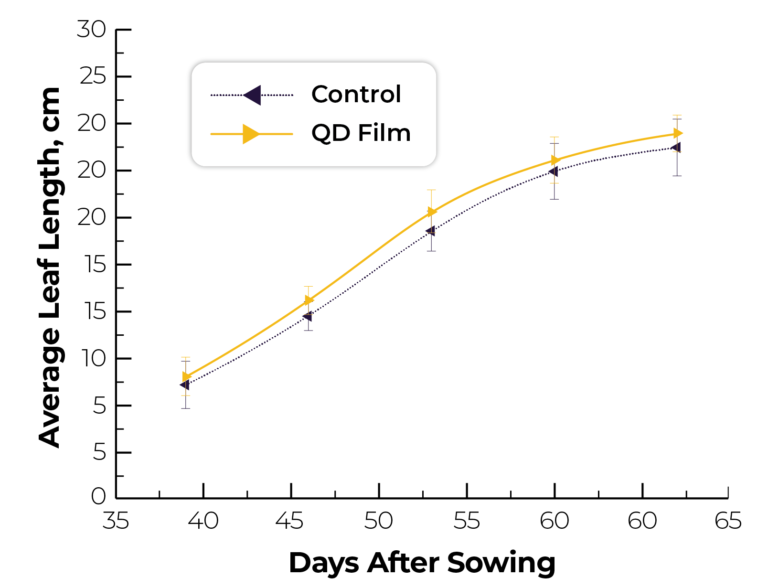
*Figure 4. Leaf length plotted against DAS, with 1 standard deviation error bars.
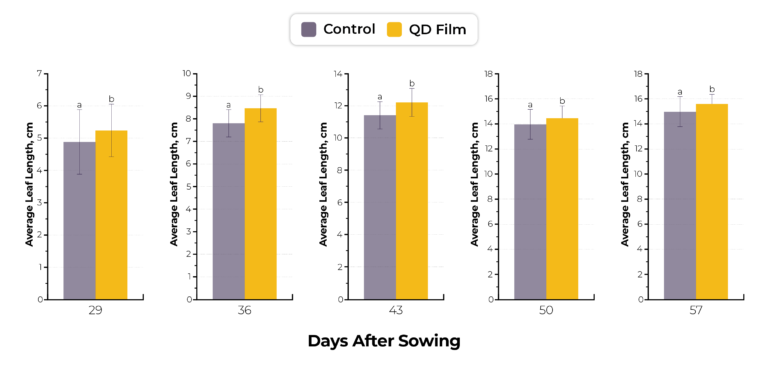
*Figure 5. Average leaf lengths for different DAS ranges for staggered measurements, with 1 standard deviation error bars. Plots marked with the same letter are not statistically significant beyond a 95% confidence threshold. Plots marked with different letters are statistically significant beyond a 95% confidence threshold.
DAILY LIGHT INTEGRAL
Light intensity balance was important to quantify in this trial in order to isolate the effects of spectral quality. The two sides of the trial must balance light intensity as closely as possible in order to provide comparable results. Daily light integral (DLI) describes the number of photosynthetically active photons (light in the 400-700 nm range) that are delivered per unit area over a 24-hour period, and is the typical cumulative metric for measuring light intensity over crops. DLI values for the QD film and control groups are plotted below in Figure 6, ranging from 13-27 mol m-2 d-1 throughout the experiment dates.
Seasonal and daily geometric changes in weather and sun angle interacting with the infrastructure of the greenhouse caused DLI differences to vary as the season changed from summer to winter. Individual daily DLI differences between the QD film and control groups fluctuated from +15% to -15% over the course of the trial due to seasonal sun angle interactions with greenhouse infrastructure. DLI differences summed over the grow duration of each harvest group were tighter, varying from +8% to -7% (see Figure 6). The average difference in DLI between the QD film and control areas, averaged over the grow duration of each harvest group for all 35 harvests, was +2.1%, with the QD film side seeing slightly more light intensity on average. Overall this was a fairly even DLI balance, certainly less than the magnitude of the yield differences observed, +4% to +28%.
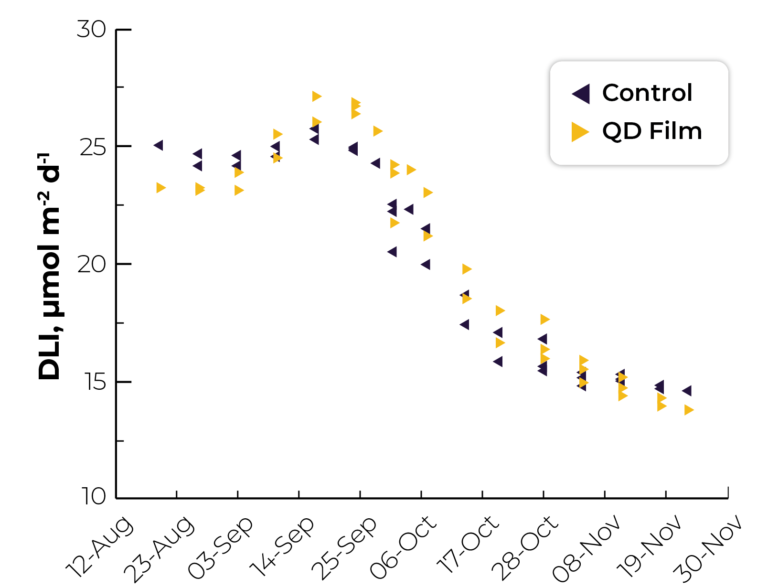
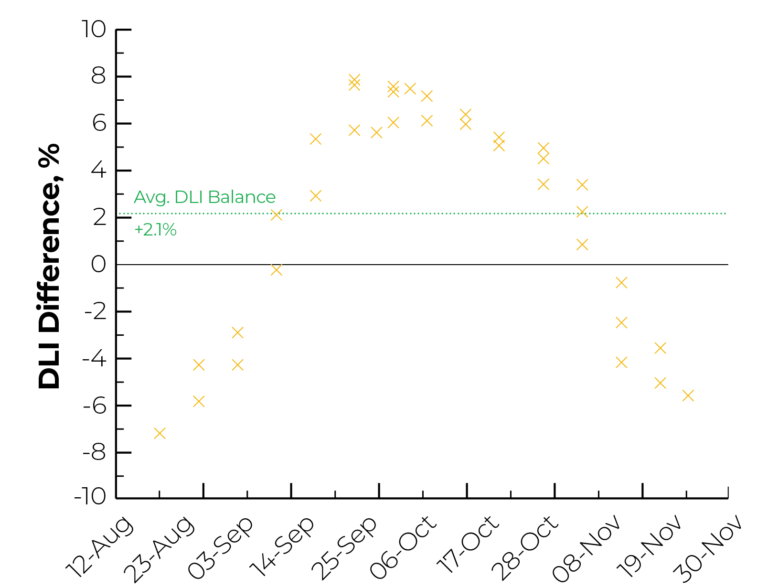
*Figure 6. Top: Individual average DLI values for each of the 35 staggered subgroup harvests. Bottom: DLI percentage surplus/deficit over the course of the experiment. Values represent cumulative DLI for a given crop, plotted at that crop’s harvest date.
CONCLUSION
This study exhibited that 600-nm UbiGro quantum dot luminescent greenhouse films applied over Coastal Star romaine lettuce increased both yields (+17% at maturity) and leaf lengths (+6.1% average increase), allowing growers to achieve faster growth rates (2-3 days faster) and higher productivity in the greenhouse.
Because achieving statistically significant results is challenging with biological variance and limited scope, larger commercial trials are needed to clarify and further validate the results observed here.
The content & opinions in this article are the author’s and do not necessarily represent the views of AgriTechTomorrow
Comments (0)
This post does not have any comments. Be the first to leave a comment below.
Featured Product