Look at any textbook on botany and you will find this maxim: plants respond to optical radiation in the spectral range of 280 nm to 800 nm.The question is, how was this spectral range (sometimes referred to as Photobiologically Active Radiation, or PBAR) determined?
 The Effect of Near-Infrared Radiation on Plants
Ian Ashdown, Senior Scientist | SunTracker Technologies
This question addresses issues beyond mere academic curiosity. Recent studies, both in the laboratory and in the field, have shown that ultraviolet-C radiation – optical radiation with wavelengths shorter than 280 nm – offers significant economic benefits for horticultural applications. The effects and potential economic benefits of near-infrared radiation – optical radiation with wavelengths longer than 800 nm – have yet to be explored.
Ultraviolet Radiation
The reason for choosing 280 nm as the lower limit of PBAR is simple: plants in the wild are simply not exposed to ultraviolet-C radiation. As shown by the terrestrial solar spectrum in Figure 1, the atmospheric ozone layer effectively blocks any significant amount of ultraviolet-C radiation (100 nm to 280 nm) from reaching the Earth’s surface.
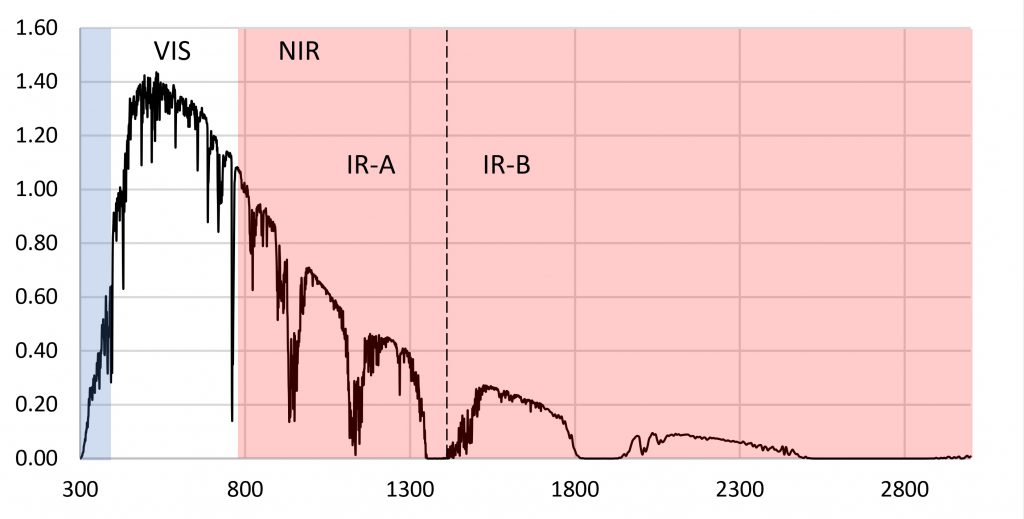
FIG. 1 – Terrestrial solar spectrum (ASTM G173-03).
The logic of excluding UV-C radiation from the definition of PBAR may be sound, but it has had unintentional consequences. We have had the ability to produce UV-C radiation for ultraviolet germicidal irradiation (UVGI) applications for over a century (e.g., Kowalski 2009), and low-pressure mercury vapor lamps generating 254 nm UV-C radiation have been used in hospitals and food processing facilities for disinfection purposes since the 1930s. However, it has only been in the past decade or so that UV-C irradiation (mostly using 254 nm UV-C lamps) has been studied and commercialized for pre- and post-harvesting applications in horticulture (e.g., Aarrout et al. 2020, Urban et al. 2016).
The use of UV-C radiation in commercial horticultural applications, including in open fields, greenhouses, and enclosed vertical farms, is proving to have important economic benefits in terms of plant health and reducing spoilage post-harvest. This therefore begs the question: by excluding near-infrared radiation (NIR) from the definition of PBAR, what (if anything) are we missing?
Far-red and the Phytochromes
To understand why 800 nm was chosen, we first need to look at the phytochromes, a class of photoreceptors that control numerous functions in higher plants, including seed germination, shade avoidance, photomorphogenesis, stem elongation, branching, circadian rhythms, root growth, and flowering times (e.g., Smith 2000 and Wang et al. 2015).
A phytochrome molecule has two isoforms, or states. Its ground state, designated Pr, preferentially absorbs red light with a peak spectral absorptance at approximately 660 nm. Upon absorbing a red photon, the molecule undergoes a conformational change to become the Pfr isoform. Left in the dark, this isoform will eventually revert to the Pr ground state. However, the molecule will also revert to the ground state if it absorbs a far-red photon with a peak spectral absorptance at approximately 725 nm.
The Pfr isoform regulates physiological changes in plants, and so it represents the biologically active form of phytochrome. It is, in other words, a biological switch. The relative concentration of Pr to Pfr will depend on the ratio of red to far-red light (expressed as R:FR) incident upon the plant leaves, and the plant will respond accordingly (although often in a species-specific manner).
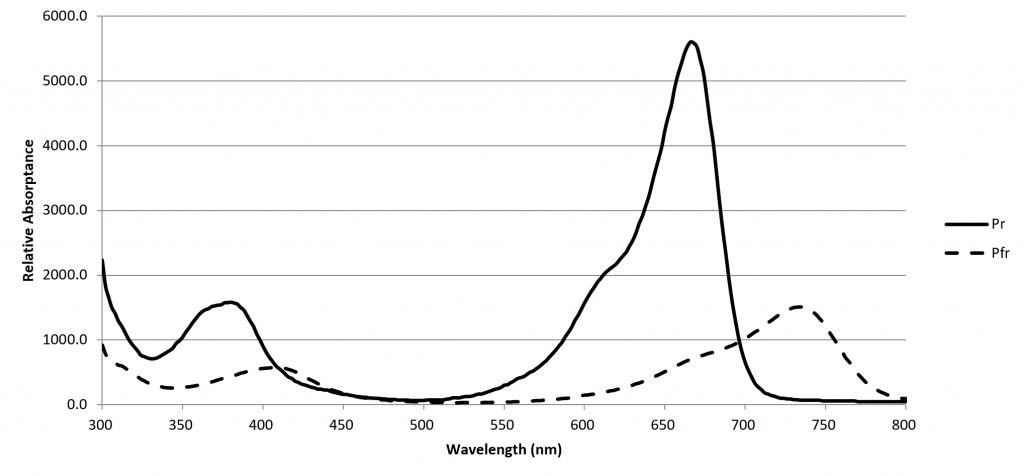
FIG. 2 – Phytochrome spectral absorptances (from Sager et al. 1988).
The role of red and far-red light (which is nowadays defined by ASABE 2017 as the spectral region of 700 nm to 800 nm) was discovered by Borthwick et al. (1952). They determined that red light in the region of 525 nm to 700 nm promoted the germination of lettuce seeds (Lactuca sativa L.) with a peak spectral response at 660 nm, while far-red light in the region of 700 nm to 820 nm inhibited germination, with a peak spectral response of roughly 720 nm.
The spectral absorptances of Pr and Pfr were measured in vitro by Butler et al. (1964), Gardner and Graceffo (1982), and Sager et al. (1988), with moderately similar results. Today, the high-resolution (2 nm) dataset of Sager et al. is most commonly referenced.
Of note however is the spectral limit for these datasets: 800 nm. Visible light spectroradiometers typically have a spectral range of 350 nm to 800 nm. Wider spectral ranges are possible, but at the cost of reduced spectral resolution. Thus, while near-infrared spectroradiometers are available, they typically have spectral ranges on the order of 650 nm to 1100 nm. The decision therefore to define 800 nm as the limit of PBAR may have been dependent in part on the limitations of laboratory equipment.
This would not appear to be a serious issue, however, as the spectral absorptances of both Pr and Pfr clearly do not extend significantly beyond 800 nm … so why bother looking?
Near-infrared Radiation
A review of the academic literature identified only three papers that considered the effect of NIR on plants. Flint and McAlister (1936) studied the effect of different spectral bands on the inhibition of lettuce seed germination, but it is unclear from their paper what data points were used to generate the plot shown in Figure 3. (The spectral bandwidth was approximately 20 nm.) Even if the small circles represent five peak wavelengths, however, the inhibition of 80 percent at 800 nm is contrary to the Pfr spectral absorptance at this wavelength.
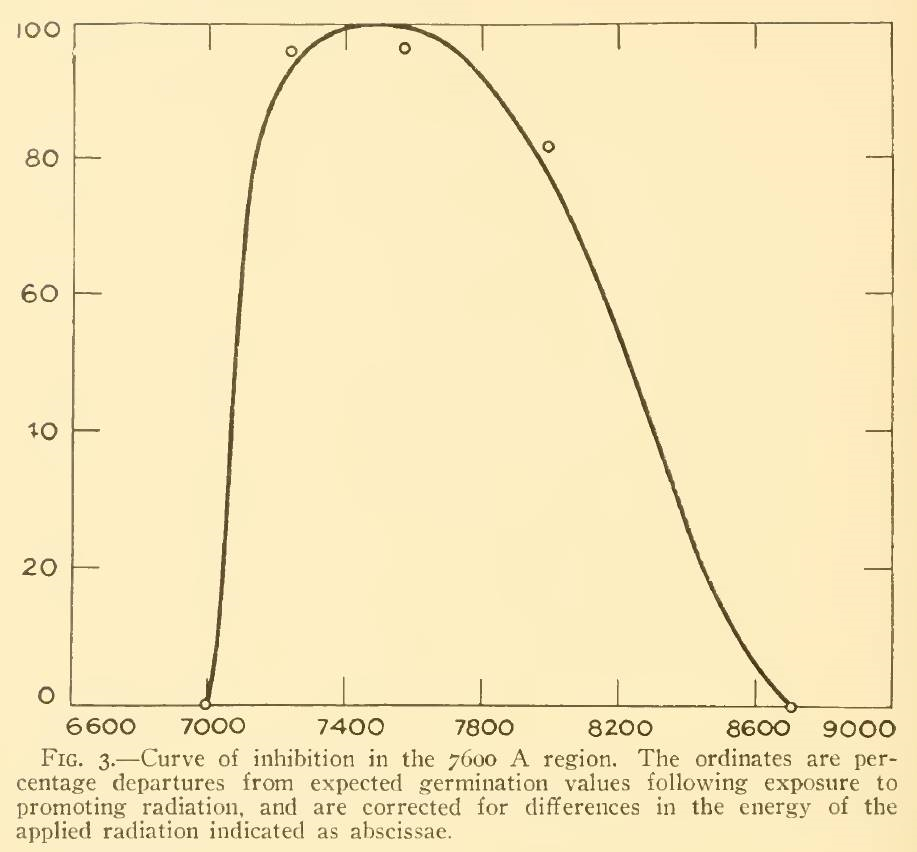
FIG. 3 – Lettuce seed germination inhibition vs wavelength (from Flint and McAlister 1936).
Schäfer et al. (1982) and Johnson et al. (1995) studied the effects of NIR on sprouting common oat (Avena sativa) seeds grown without visible light. Using NIR light-emitting diodes with peak wavelengths of 916 nm (nominal 880 nm) and 958 nm (nominal 935 nm), Johnson et al. noted morphological changes such as coleoptile elongation, advanced leaf emergence and increased gravitropic response (Figure 4).
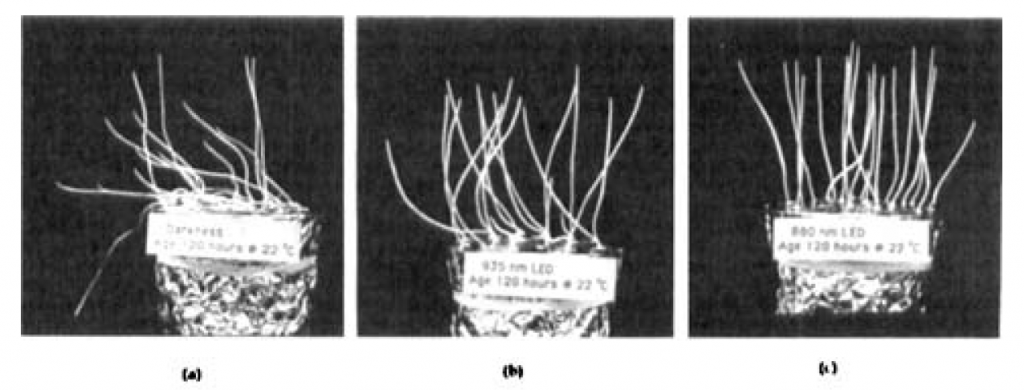
FIG. 4 – Gravitropic responses of Avena sativa (common oat) seedling coleoptiles grown under: (a) darkness; (b) nominal 935 nm IR LEDs; and (c) nominal 880 nm IR LEDs (from Johnson et al. 1995).
From a horticultural perspective, these are curious but not particularly useful effects of NIR on cereal grasses grown in darkness. These studies leave the question of whether NIR has any effect on higher plants grown under electric lighting unanswered.
NIR and Daylight
What is surprising about this question is that we should already have answers for any plant species grown in greenhouses versus the same species grown under LED lighting in vertical farms. Most greenhouse glazing is either soda-lime glass with almost constant spectral transmittance from 350 nm to 2800 nm (Figure 5), or polycarbonate panels with constant spectral transmittance from 390 nm to 1100 nm. Referring to Figure 1, the relative radiant power of the solar spectrum from 800 nm to 900 nm is 19 percent of that from 400 nm to 800 nm. The greenhouse glazing has only minimal impact on the spectral power distribution of visible light and NIR (and hence the R:FR ratio) inside the greenhouse.
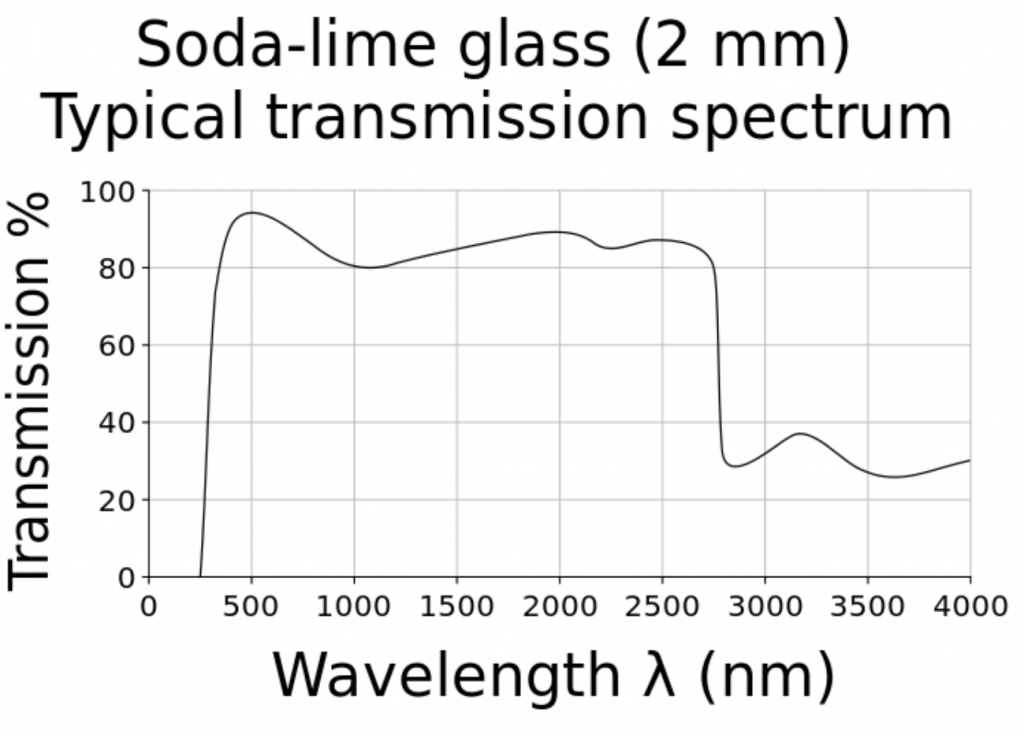
FIG. 5 – Soda-lime glass spectral transmittance. (Source: Wikipedia.)
In practice, however, it would be difficult to conduct experiments comparing the effects of daylight versus electric lighting. It would, for example, be necessary to match both the photosynthetic photon flux density (PPFD) and the spectral power distribution of daylight at the plant canopy. In addition, the inherent variability of daylight and consequent changes in PPFD would further complicate the experiments.
NIR and LED Grow Lights
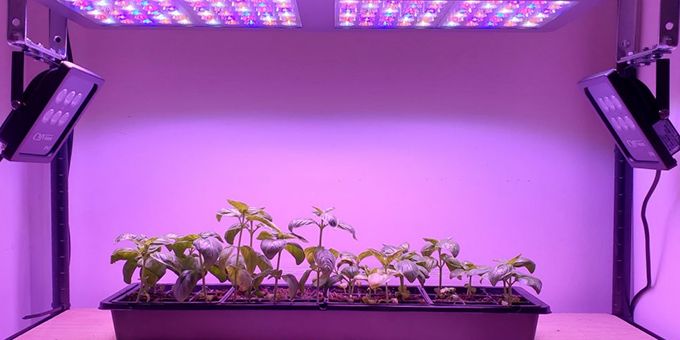
An obvious solution is to grow plants under LED grow lights with and without additional NIR radiation sources. A 260-watt VIPARSPECTRA TC600 LED grow light system was therefore chosen to investigate the issue. This luminaire features twelve spectral bands provided by 10 quasimonochromatic and two phosphor-coated white light LEDs:
- 440 nm
- 445 nm
- 460 nm
- 475 nm
- 580 nm
- 595 nm
- 615 nm
- 620 nm
- 660 nm
- 730 nm
- 3000K white light
- 7500K white light
with the relative spectral power distribution, measured with a calibrated Ocean Optics STS-VIS spectroradiometer, shown in Figure 6.
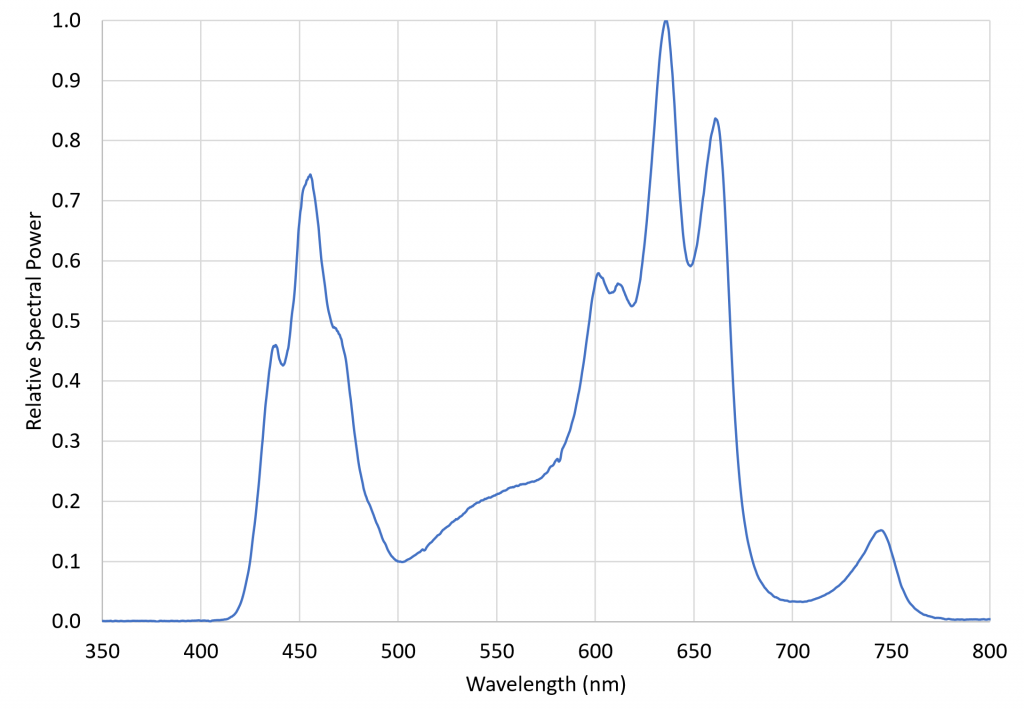
FIG. 6 – VIPARSPECTRA TC600 relative spectral power distribution.
This luminaire was chosen specifically for its inclusion of 730 nm far-red LEDs. The ratio of red light (herein defined as the spectral band of 645 nm to 685 nm) to far-red light (herein defined as the spectral band of 710 nm to 750 nm), varies from approximately 1.1 in full sunlight to roughly 0.2 in the shade, where the red light is screened by the chlorophyll in the blocking leaves. The problem with most LED grow lights is that, without far-red LEDS, their R:FR ratios can be extremely high. Using a grow light with significant far-red output thus ensures that the plants are not responding to any residual PBAR emitted by the NIR radiation sources. (The VIPARSPECTRA luminaire had a R:FR ratio of 6.61.)
Petunia
The first experiment consisted of growing petunias (Petunia x hybrida) from seed in peat moss at 20° C. The seeds sprouted in seven days under diffuse daylight before being transferred to the growth rack (Figure 7). One group of seedlings was additionally irradiated with 850 nm NIR radiation from a 4-watt Tendelux AI4 IR Illuminator with a 90-degree beam spread and an integral infrared bandpass filter. The grow light was operated with a photoperiod of 12 hours, while the NIR source was energized continuously.
A near-infrared spectroradiometer was not available to measure the spectral power distribution between 800 nm and 900 nm. However, measurements with the visible light spectroradiometer showed that any residual emission from the 850 nm LEDs below 800 nm was less than 0.3 percent of the VIPARSPECTRA peak emission.
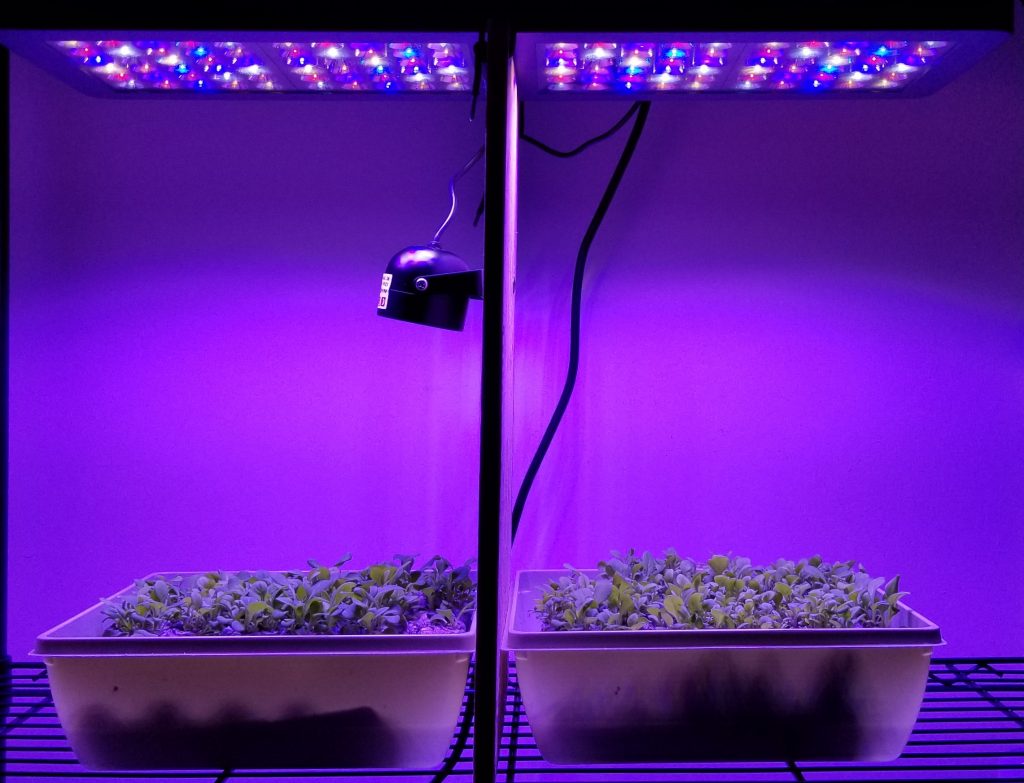
FIG. 7 – Petunia x hybrida experimental setup.
The seedlings grown under NIR appeared to develop more quickly, but the growth rate equalized as the leaves matured after seven weeks, However, the mature leaves (8 weeks) grown under NIR were noticeably darker, suggesting a greater concentration of chlorophyll.
The most noticeable morphological difference was that the plants grown under NIR were considerably more compact (Figure 8).
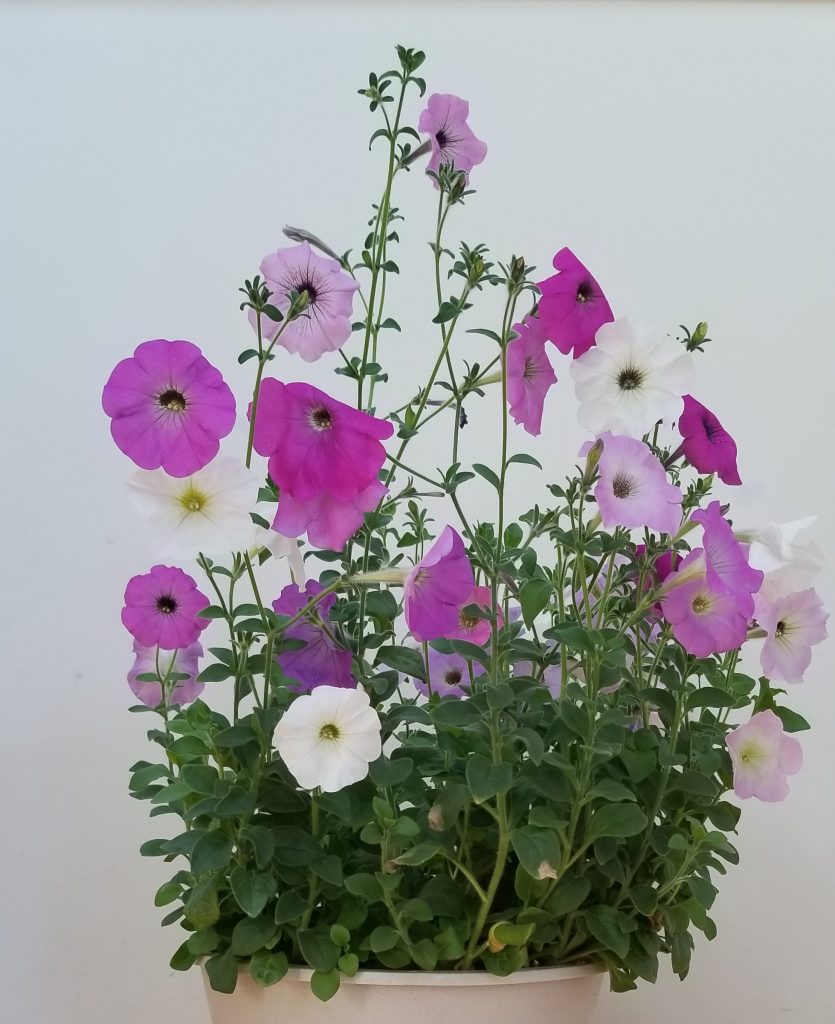
FIG. 8A – Petunia x hybrida without NIR
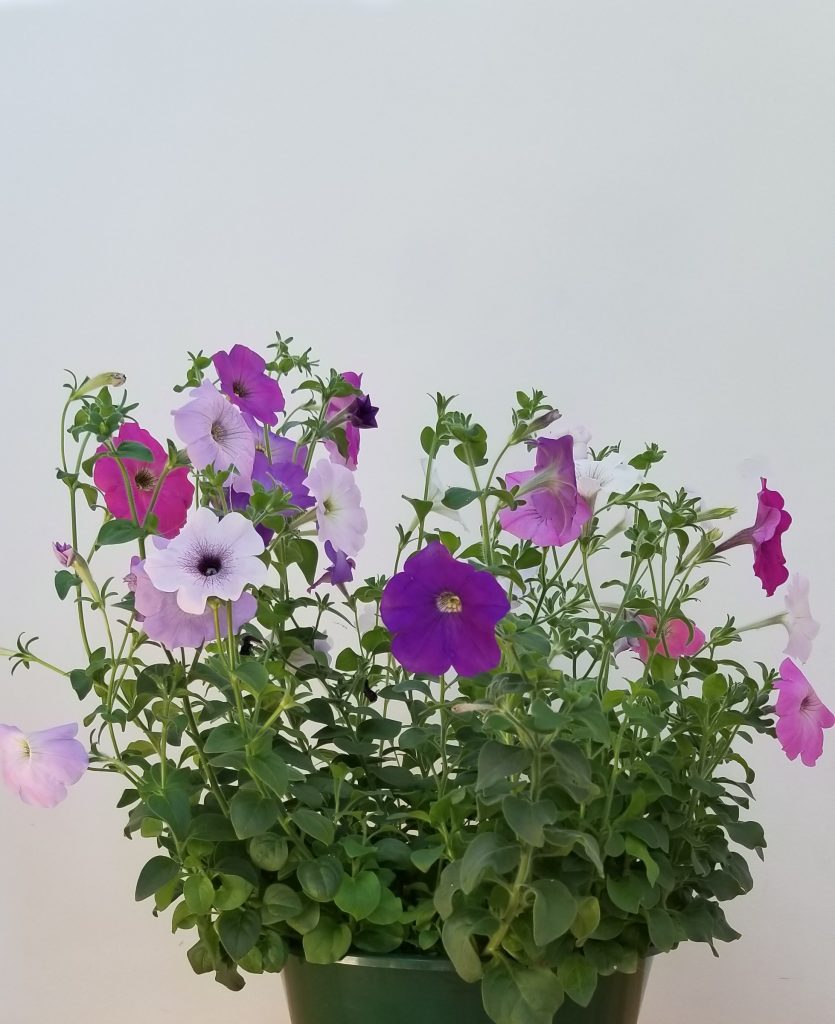
Fig. 8B – Petunia x hybrida with 850 nm IR
Sweet Basil
The second experiment consisted of growing sweet basil (Ocimum basilicum v. ‘Sweet Genovese’) from seed in potting soil at 20° C. Two groups were grown under separate VIPARSPECTRA grow light systems, with one group irradiated by two 18-watt CMVision CM-IRP6-850 IR illuminators with a 90-degree beam spread (Figure 9). Measurements with the visible light spectroradiometer again showed that any residual emission from the 850 nm LEDs below 800 nm was less than 0.3 percent of the VIPARSPECTRA peak emission. (The VIPARSPECTRA grow light system for the seedlings without NIR had an R:FR ratio of 7.14.)
The VIPARSPECTA grow lights were operated with a photoperiod of 12 hours, while the CMVision NIR sources were energized continuously.
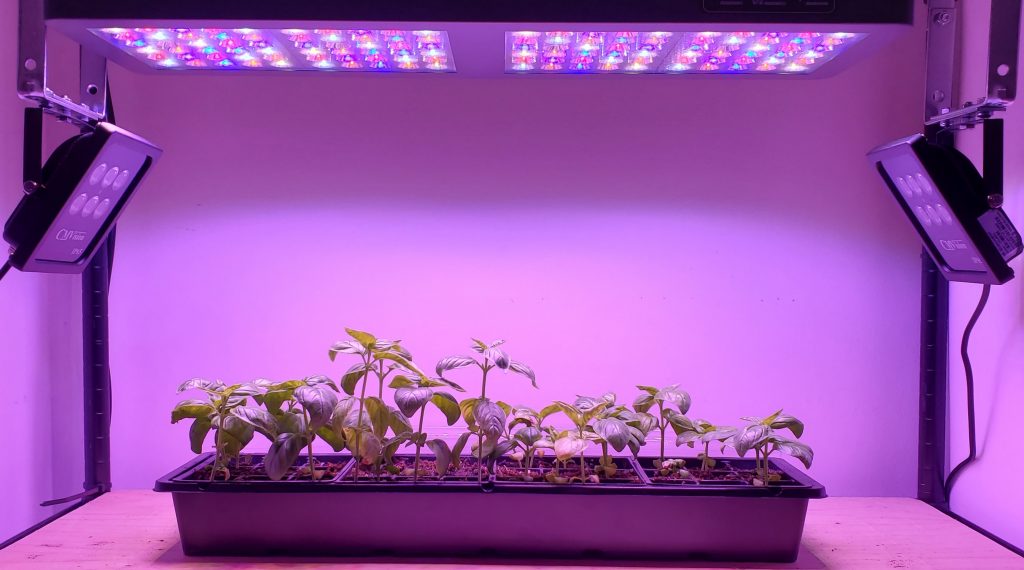
Figure 9 – Ocimum basilicum experimental setup.
The seeds without NIR irradiation germinated within one week, with a success rate of approximately 50 percent. However, the seeds with NIR irradiation germinated within two weeks, and with a success rate of approximately 35 percent.
After six weeks, there was a marked difference in stem elongation, where the plants with NIR irradiation were approximately twice as tall (Figures 10A and 10B). In addition, the plants with NIR irradiation had larger and lighter-colored leaves (Figures 11A and 11B).
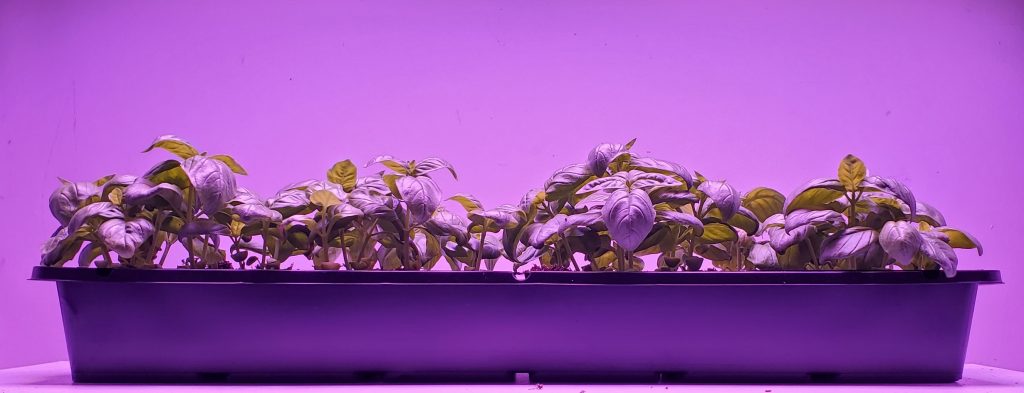
FIG. 10A –Ocimum basilicum without NIR (six weeks), side view.
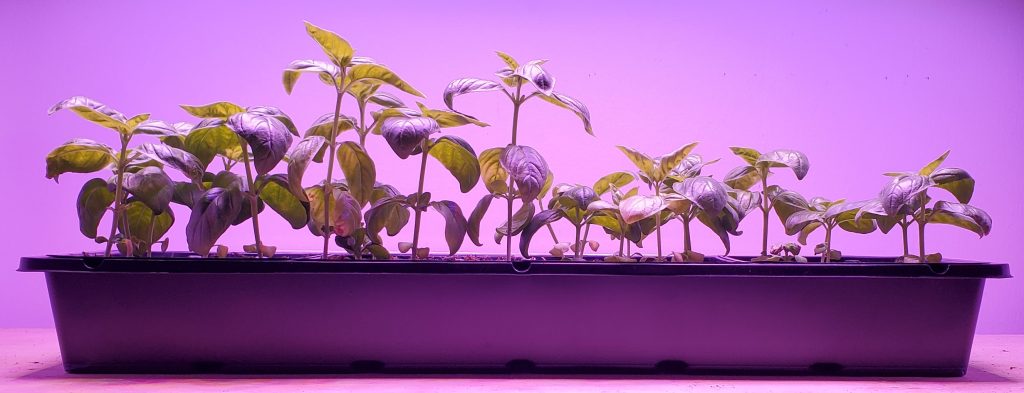
Figure 10B – Ocimum basilicum with 850 nm IR (six weeks), side view.
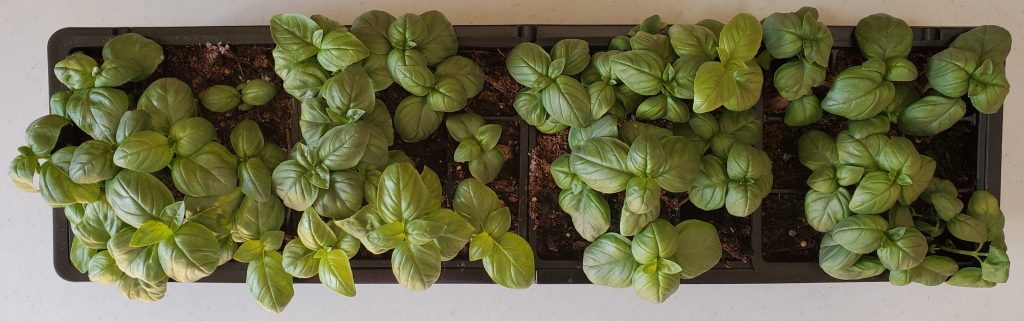
FIG. 11A – Ocimum basilicum without NIR (six weeks), top view.
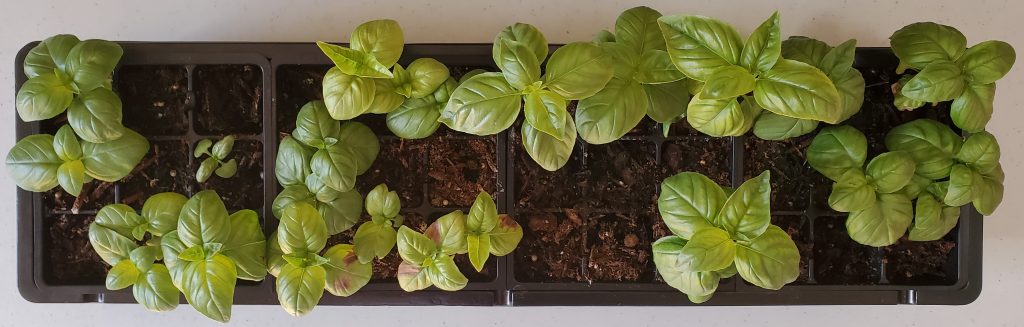
Figure 11B – Ocimum basilicum with 850 nm IR (six weeks), top view.
Conclusions
Due to the lack of quantitative spectral power distributions for the NIR irradiation of the plant canopy and the differences in NIR irradiance between the two experiments, the results observed above must be considered incomplete pending further study. However, a number of tentative conclusions can be drawn regarding constant 850 nm irradiation:
- Germination of Ocimum basilicum seeds is inhibited.
- The shade avoidance response of Petunia x hybrida appears to antagonized, resulting in a more compact plant architecture.
- The shade avoidance response of Ocimum basilicum is clearly promoted, resulting in stem elongation and thus taller plants.
- The leaf area of Ocimum basilicum is increased.
- The chlorophyll production in the leaves of Petunia x hybrida appears to be slightly increased.
- The chlorophyll production in the leaves of Ocimum basilicum appears to be moderately inhibited.
One possible explanation for these observations is that the biologically active isoform of phytochrome (Pfr) has an unreported spectral absorption band in the region of 800 nm to 900 nm. This would have the effect of reducing the Pfr content in the leaves, which in turn reduces the chlorophyll concentration (e.g., Kreslavski et al. 2018) and increases the leaf area (e.g., Boccalandro et al. 2009). This could explain the Ocimum basilicum results, but not the Petunia x hybrida results.
NIR absorption by phytochrome Pfr could further explain the inhibition of Ocimum basilicum seed germination, as demonstrated by Flint et al. (1936) and Borthwick et al. (1952) with far-red light.
The shade avoidance response of Ocimum basilicum can also be explained by NIR absorption, as this is equivalent to lowering the R:FR ratio. The plant stems will then elongate in order for the upper leaves to receive as much full sunlight as possible.
This does not, however, explain the apparent antagonism of the shade avoidance response of Petunia x hybrida. One possibility is that the lower NIR irradiance used in the experiment elicits a nonlinear response by phytochrome Pfr, although this would be more likely to have a null rather than a negative effect.
Another possibility is that there is an undiscovered photopigment with a spectral absorption band beyond 800 nm (Johnson et al. 1995). Alternatively, there may be an undiscovered spectral absorption band in one of the cryptochromes or other known photopigments involved in photomorphogenesis.
Whatever the case, it is evident that more research is required. The PBAR limit of 800 nm has been assumed for at least the past seven decades, but then the effects of UV-C radiation on plants remained unexplored for an equal length of time. The effect of near-infrared radiation of plants is a topic that deserves to be explored.
References
- ASABE. 2017. ANSI/ASABE S640 JUL2017, Quantities and Units of Electromagnetic Radiation for Plants (Photosynthetic Organisms). St. Joseph, MI: American Society of Agricultural and Biological Engineers.
- Aarrout, J., and L. Urban. 2020. “Flashes of UV-C Light: An Innovative Method for Stimulating Plant Defenses,” PLoS ONE 15(7):e0235918. DOI: 10.1371/journal.pone.0235918.
- ASTM International. ASTM G173-03(2020), Standard Tables for Reference Solar Spectral Irradiances: Direct Normal and Hemispherical on 37° Tilted Surface. West Conshohocken, PA: ASTM International; 2020.
- Boccalandro, H. E., et al. 2009. “Phytochrome B Enhances Photosynthesis at the Expense of Water-Use Efficiency in Arabidopsis,” Plant Physiology 150(2):1093-1092. DOI: 10.1104/pp.109.135509.
- Borthwick, et al. 1952. “A Reversible Photoreaction Controlling Seed Germination,” Proceedings of the National Academy of Science 38:662–666. DOI: 10.1073/pnas.38.8.662.
- Butler, W. L., et al. 1964. “Action Spectra of Phytochrome in vitro,” Photochemistry and Photobiology 3(4):521-528. DOI: 10.1111/j.1751-1097.1964.tb08171.x.
- Flint, L. H., and E. D. McAlister. 1936. “Wave Lengths of Radiation in the Visible Spectrum Inhibiting the Germination of Light-Sensitive Lettuce Seed,” Smithsonian Miscellaneous Collections 94(5):1-11.
- Gardner, G., and M. Graceffo. 1982. “The Use of a Computerized Spectroradiometer to Predict Phytochrome Photoequilibria under Polychromatic Irradiation,” Photochemistry and Photobiology 36(3):349-354. DOI: 10.1111/j.1751-1097.1982.tb04385.x.
- Kowalski, W. 2009. Ultraviolet Germicidal Irradiation Handbook: UVGI for Air and Surface Disinfection. Berlin, Germany: Springer-Verlag.
- Kreslavski, V. D., et al. 2018. “The Impact of the Phytochromes on Photosynthetic Processes,” BBA – Bioenergetics 1859:400-408. DOI: 10.1016/j.bbabio.2018.03.003.
- Kusuma, P., and B. Bugbee. 2021. “Far-red Fraction: An Improved Metric for Characterizing Phytochrome Effects on Morphology,” J. American Society of Horticultural Scientists 146(1):3-13. DOI: 10.21273/JASHS05002-20.
- Sager, J. C., et al. 1988. “Photosynthetic Efficiency and Phytochrome Photoequilibria Determination Using Spectral Data,” Trans. ASAE 31(6):1882-1889.
- Schäfer, E., et al. 1972. “In vivo Measurement of the Phytochrome Photostationary State in Far Red Light,” Photochemistry and Photobiology 15(5):457-464. DOI: 10.1111/j.1751-1097.1972.tb06257.x.
- Smith, H. 2000. “Phytochromes and Light Signal Perception by Plants – An Emerging Synthesis,” Nature 407:585-591. DOI: 10.1038/35036500.
- Urban, L., et al. 2016. “Understanding the Physiological Effects of UV-C Light and Exploiting its Agronomic Potential Before and After Harvest,” Plant Physiology and Biochemistry 105:1-11. DOI: 10.1016/j.plaphy.2016.04.004.
- Wang, H., et al. 2015. “Phytochrome Signaling: Time to Tighten Up the Loose Ends,” Molecular Plant 8:540-551. DOI: 10.1016/j.molp.2014.11.021.
The content & opinions in this article are the author’s and do not necessarily represent the views of AgriTechTomorrow
Comments (0)
This post does not have any comments. Be the first to leave a comment below.
Featured Product