Advancements like nutrient monitoring and early disease detection are only possible using precise, repeatable measurements. To generate such measurements, a multispectral camera must be a “narrow band” camera.
Why Narrow Bands Matter
Contributed by | MicaSense
Reposted with permission from the MicaSense blog:
Multispectral imaging is changing traditional agricultural practices, allowing for more efficient resource management. However, not all multispectral cameras are alike. Advancements like nutrient monitoring and early disease detection are only possible using precise, repeatable measurements. To generate such measurements, a multispectral camera must be a “narrow band” camera. This article will explain why this is the case and delve deeper into the benefits of a narrow band multispectral sensor.
The goal of multispectral imagery
The primary goal of multispectral imaging in agriculture is to detect subtle variation in plant health before visible symptoms appear. For instance, a grower could spot a small reduction in a plant’s chlorophyll content before the leaves start to turn yellow.
Such early detection is possible because the amount of sunlight plants reflect in different wavelengths vary as their health changes. Multispectral sensors then capture and record this variation. However some sensors capture more precise data than others. If a sensor measures too broad a region of the light spectrum, any subtle variation will be lost.
The benefits of a narrow band sensor
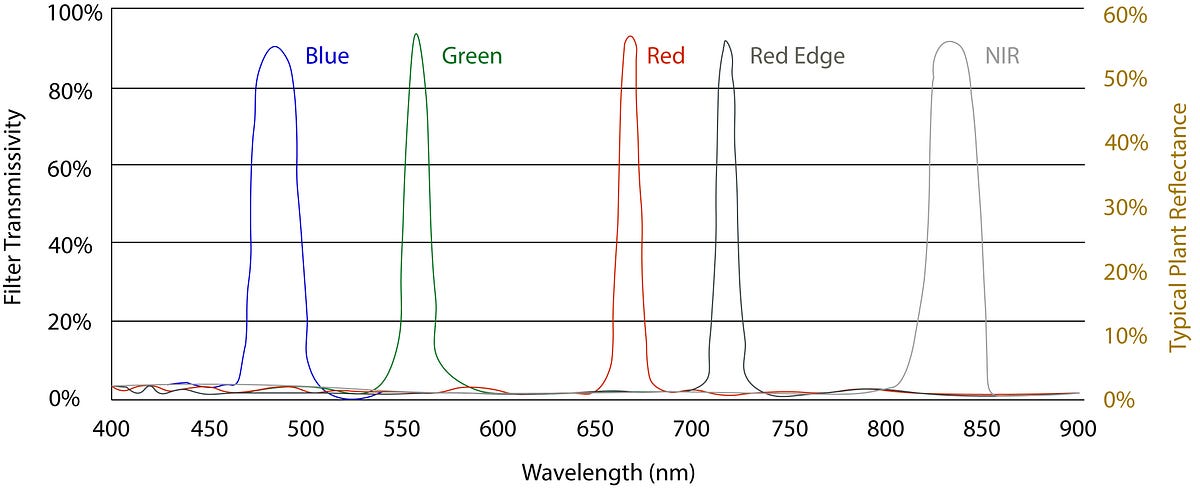
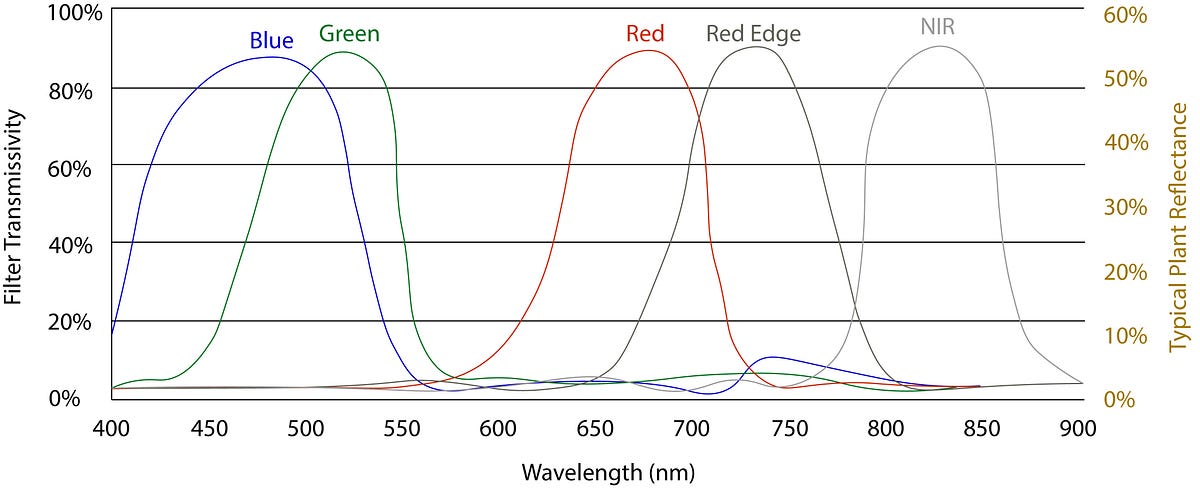
Comparison of a narrow band sensor (above) and a broadband sensor (below). As noted, in a broadband sensor the wavelength ranges of the different bands overlap considerably.
The band center and its bandwidth are key in determining how precise a multispectral sensor is. Broadband sensors, such as converted cameras, measure large “chunks” of the light spectrum, taking the average reflectance in that region to produce one single value. On the contrary, narrow band sensors capture the reflectance of a very specific area of the spectrum. This yields information that is more precise and insightful about subtle changes that may be happening at key points.
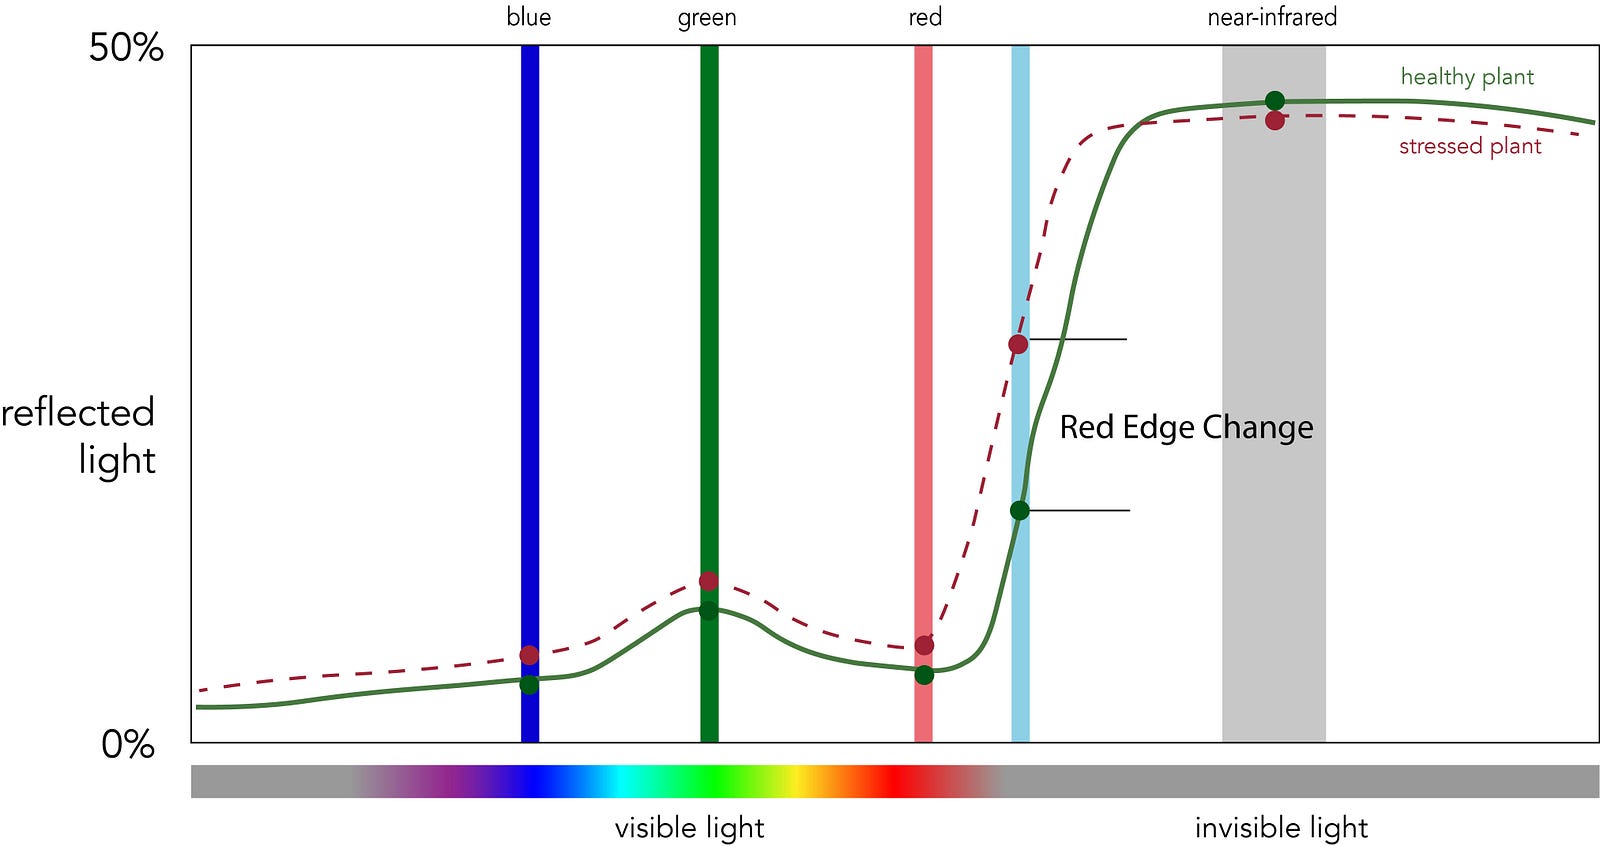
To demonstrate, let’s examine the red edge waveband. The red edge band is located between the red and NIR bands and plays a key role in deriving plant chlorophyll content. If a plant is experiencing stress, it’s likely that variation will be the most obvious in the red edge band, as shown in the graph above. When comparing the red, red edge and NIR bands, the largest magnitude of change shows up in the red edge band, therefore it is the most critical to measure. A wide red edge waveband would likely overlap with neighboring bands and suffer from data contamination, resulting in a less precise measurement.
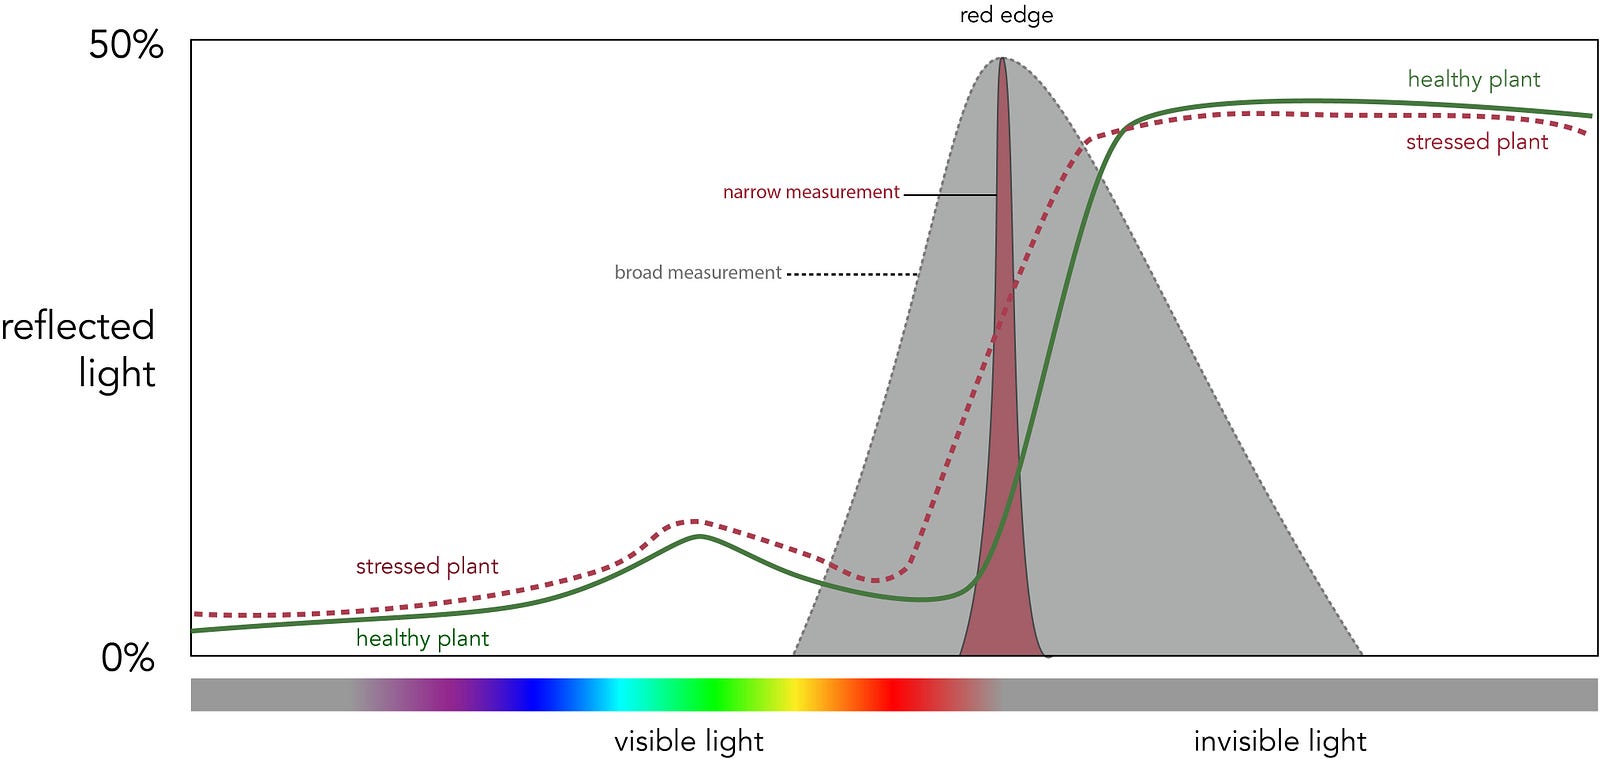
Narrow band vs. broad band sensor. The narrow band sensor (red) is more sensitive to the different levels of chlorophyll than the wide band sensor (gray). The narrow band is 1.6 times more sensitive than the wide band.
The bandwidths of a multispectral sensor will also impact the vegetation indices resulting from the collected data. Vegetation indices are created by combining different bands to highlight certain features in the vegetation. Since broadband cameras have a wider range of values, the resulting indices won’t highlight subtle variation. Instead, a narrow band camera will collect more precise measurements, resulting in indices capable of detecting changes in the health of the plant at early stages.

Comparing the resulting NDVI map from a broadband camera (on the left) and the NDVI map from a narrow band camera (on the right,) it can be noted that the index generated from the narrow band camera is more sensitive to subtle variation, detecting health issues earlier than a broadband sensor.
Conclusion
In agriculture, broadband sensors, such as converted cameras, work well for the big picture, allowing for the generation of RGB maps and generic indices like NDVI. However, the information provided by these cameras is limited and does not allow further analysis of the field over time.
A narrow band camera, on the other hand, provides more detailed and accurate information by capturing precise measurements of specific wavelengths, which allows for early detection of health issues. This gives farmers more tools and information to enable them to make better management decisions.
To view the different vegetative indices available in Atlas, check out our example data set. If you have a case study with RedEdge, Sequoia, or Atlas that you would like to showcase, please send us an email here.
The content & opinions in this article are the author’s and do not necessarily represent the views of AgriTechTomorrow
Comments (0)
This post does not have any comments. Be the first to leave a comment below.
Featured Product