Growers know their crop and the pitfalls that diminish yield quality and quantity. Walking the field garners valuable information, but not all problems are visible to the naked eye, especially during early stages of a pest infestation, disease onset, or nutrient deficiency.
Contributed by | MicaSense
Reposted with permission from the MicaSense blog:
Growers know their crop and the pitfalls that diminish yield quality and quantity. Walking the field garners valuable information, but not all problems are visible to the naked eye, especially during early stages of a pest infestation, disease onset, or nutrient deficiency. To help identify issues sooner, growers are turning to technologies like multispectral imaging.
View the Atlas data from this article here.
Multispectral cameras work by measuring the different bands (or colors) of light reflected off the leaf canopy. Single-imager cameras capture two bands of light, red and near infrared. From the information gathered, a vegetation index called NDVI can be created. NDVI is one of the most widely known indices and it is commonly used to analyze plant vigor. But NDVI does not always tell the whole story –sometimes more sophisticated indices are needed. These advanced vegetation indices can be achieved through use of narrowband multispectral cameras like Sequoia or RedEdge. These professional multispectral cameras capture four to five bands of light, as opposed to the two bands captured using a single-imager camera.
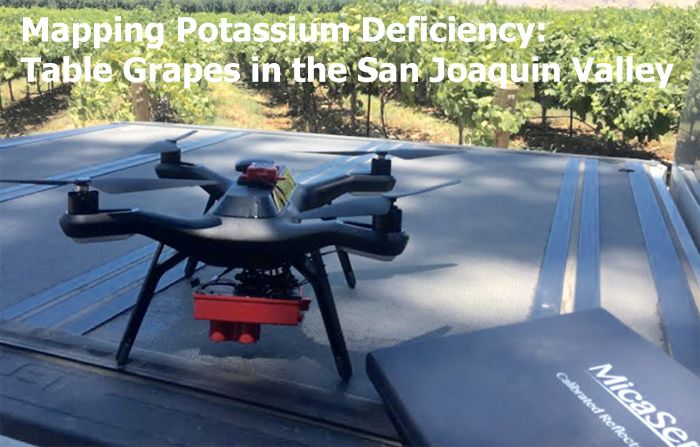
A table grape vineyard in California’s San Joaquin Valley illustrates the value that a professional multispectral camera like RedEdge can provide to a grower. Minor nutrient deficiency issues were detected and the grower decided to leverage multispectral imaging to compliment leaf tissue analysis.
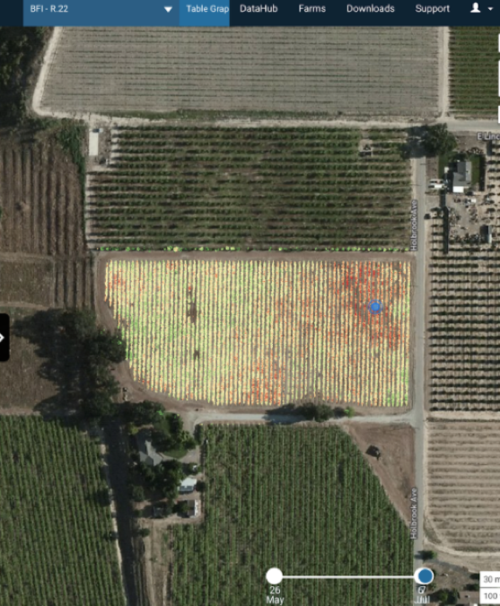
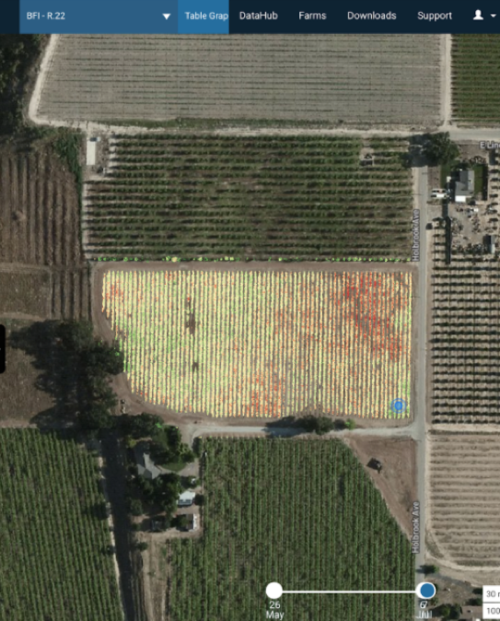
The early season leaf tissue analyses pointed to issues with nutrient uptake, but the extent of nutrient deficiency was not known. More information was needed to plan corrective action. After flying the field with RedEdge, the grower processed the data in MicaSense Atlas and began analyzing the vegetation index maps provided. An NDVI map of the vineyard indicated vines on the perimeter and corners of the field were stressed. An image of this NDVI map is shown below, stressed areas appear in yellow.

NDVI layer indicates in yellow the stressed vines on the field perimeter.
The NDVI map was not helping the grower get a better pulse on the extent of the issue. The northeast corner of the field had already been monitored for the last couple years — a change in soil type in this area was thought to be a leading cause for the lack of nutrient uptake. To investigate further the grower looked beyond NDVI, turning to the Chlorophyll Map available through use of Sequoia or RedEdge sensors and exclusive to the MicaSense Atlas platform. Analysis of the Chlorophyll Map provided some surprising new insights.

MicaSense’s Chlorophyll Map, available in Atlas, highlights in red vines that are chlorotic. In-field inspection and leaf analyses indicate potassium deficiency may be a cause of the plant stress.
In the grower’s own words, “NDVI shows us some general trends throughout the field, but when we look at the Chlorophyll Map, the northeast corner, and a pocket at the South end of the field light up. Moving to the South end of the field, I knew the second area was weak, but didn’t realize that the stress was almost as pronounced as the northeast corner. The Chlorophyll Map helped in quantifying things, and in getting a good pulse on what’s happening in the field. We thought we had a solid approach to treating the field after our first tissue samples, but as the season continued, the two areas progressed. Late tissue analyses showed low levels of potassium.”
A lack of potassium in vines can lead to issues in bunch/berry size, poor color uniformity and loss of leaves, leading to fruit sunburn. In each case, crop quality and quantity suffer.
MicaSense’s Chlorophyll Map provides a measurement that is proportional to the chlorophyll content in leaves, highlighting areas in red where leaves are expected to be chlorotic, or having low levels of chlorophyll. Chlorosis is a symptom of insufficient potassium supply, so the map easily pointed the grower to the areas most afflicted by potassium deficiency.
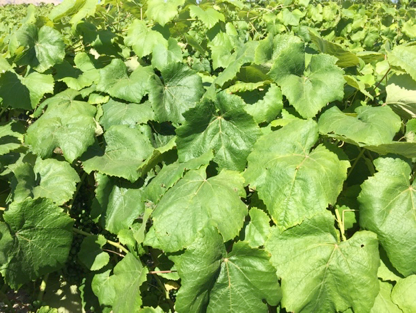
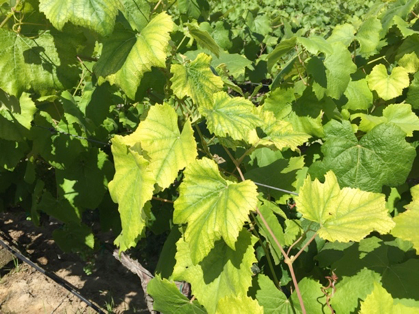
Healthy (left) and stressed (right) vines, as seen from in-field inspection.
Armed with the additional information from the Chlorophyll Map, the grower was able to better determine soil and leaf sampling locations in the field. He was also able to record the locations where soil and leaf analyses were taken, using the GPS-guided field notes functionality in Atlas. All this information was stored and available for review in anticipation of the next growing season.
Using the field notes functionality in Atlas, the grower records where soil and leaf samples are taken, as they are collected.
Reflecting on the data gathered and the results of the previous growing season the grower explains that, “In setting up for the 2017 season, we’ve created management zones within Atlas, and have used the GPS-guide to pull soil samples accordingly. The soil samples point to a few other issues blocking nutrient uptake, and even water uptake. We’ll make a few adjustments moving forward; when we think we’re approaching it correctly, it’s a huge asset to have the RedEdge data as a bumper. The MicaSense products are giving us more visibility into the problems we’re facing, helping us adjust our approach and look for a better harvest next year.”
To view the different vegetative indices available in Atlas, check out our example data set. If you have a case study with RedEdge, Sequoia, or Atlas that you would like to showcase, please send us an email here.
The content & opinions in this article are the author’s and do not necessarily represent the views of AgriTechTomorrow
Comments (0)
This post does not have any comments. Be the first to leave a comment below.
Featured Product